 Image 1 of 2
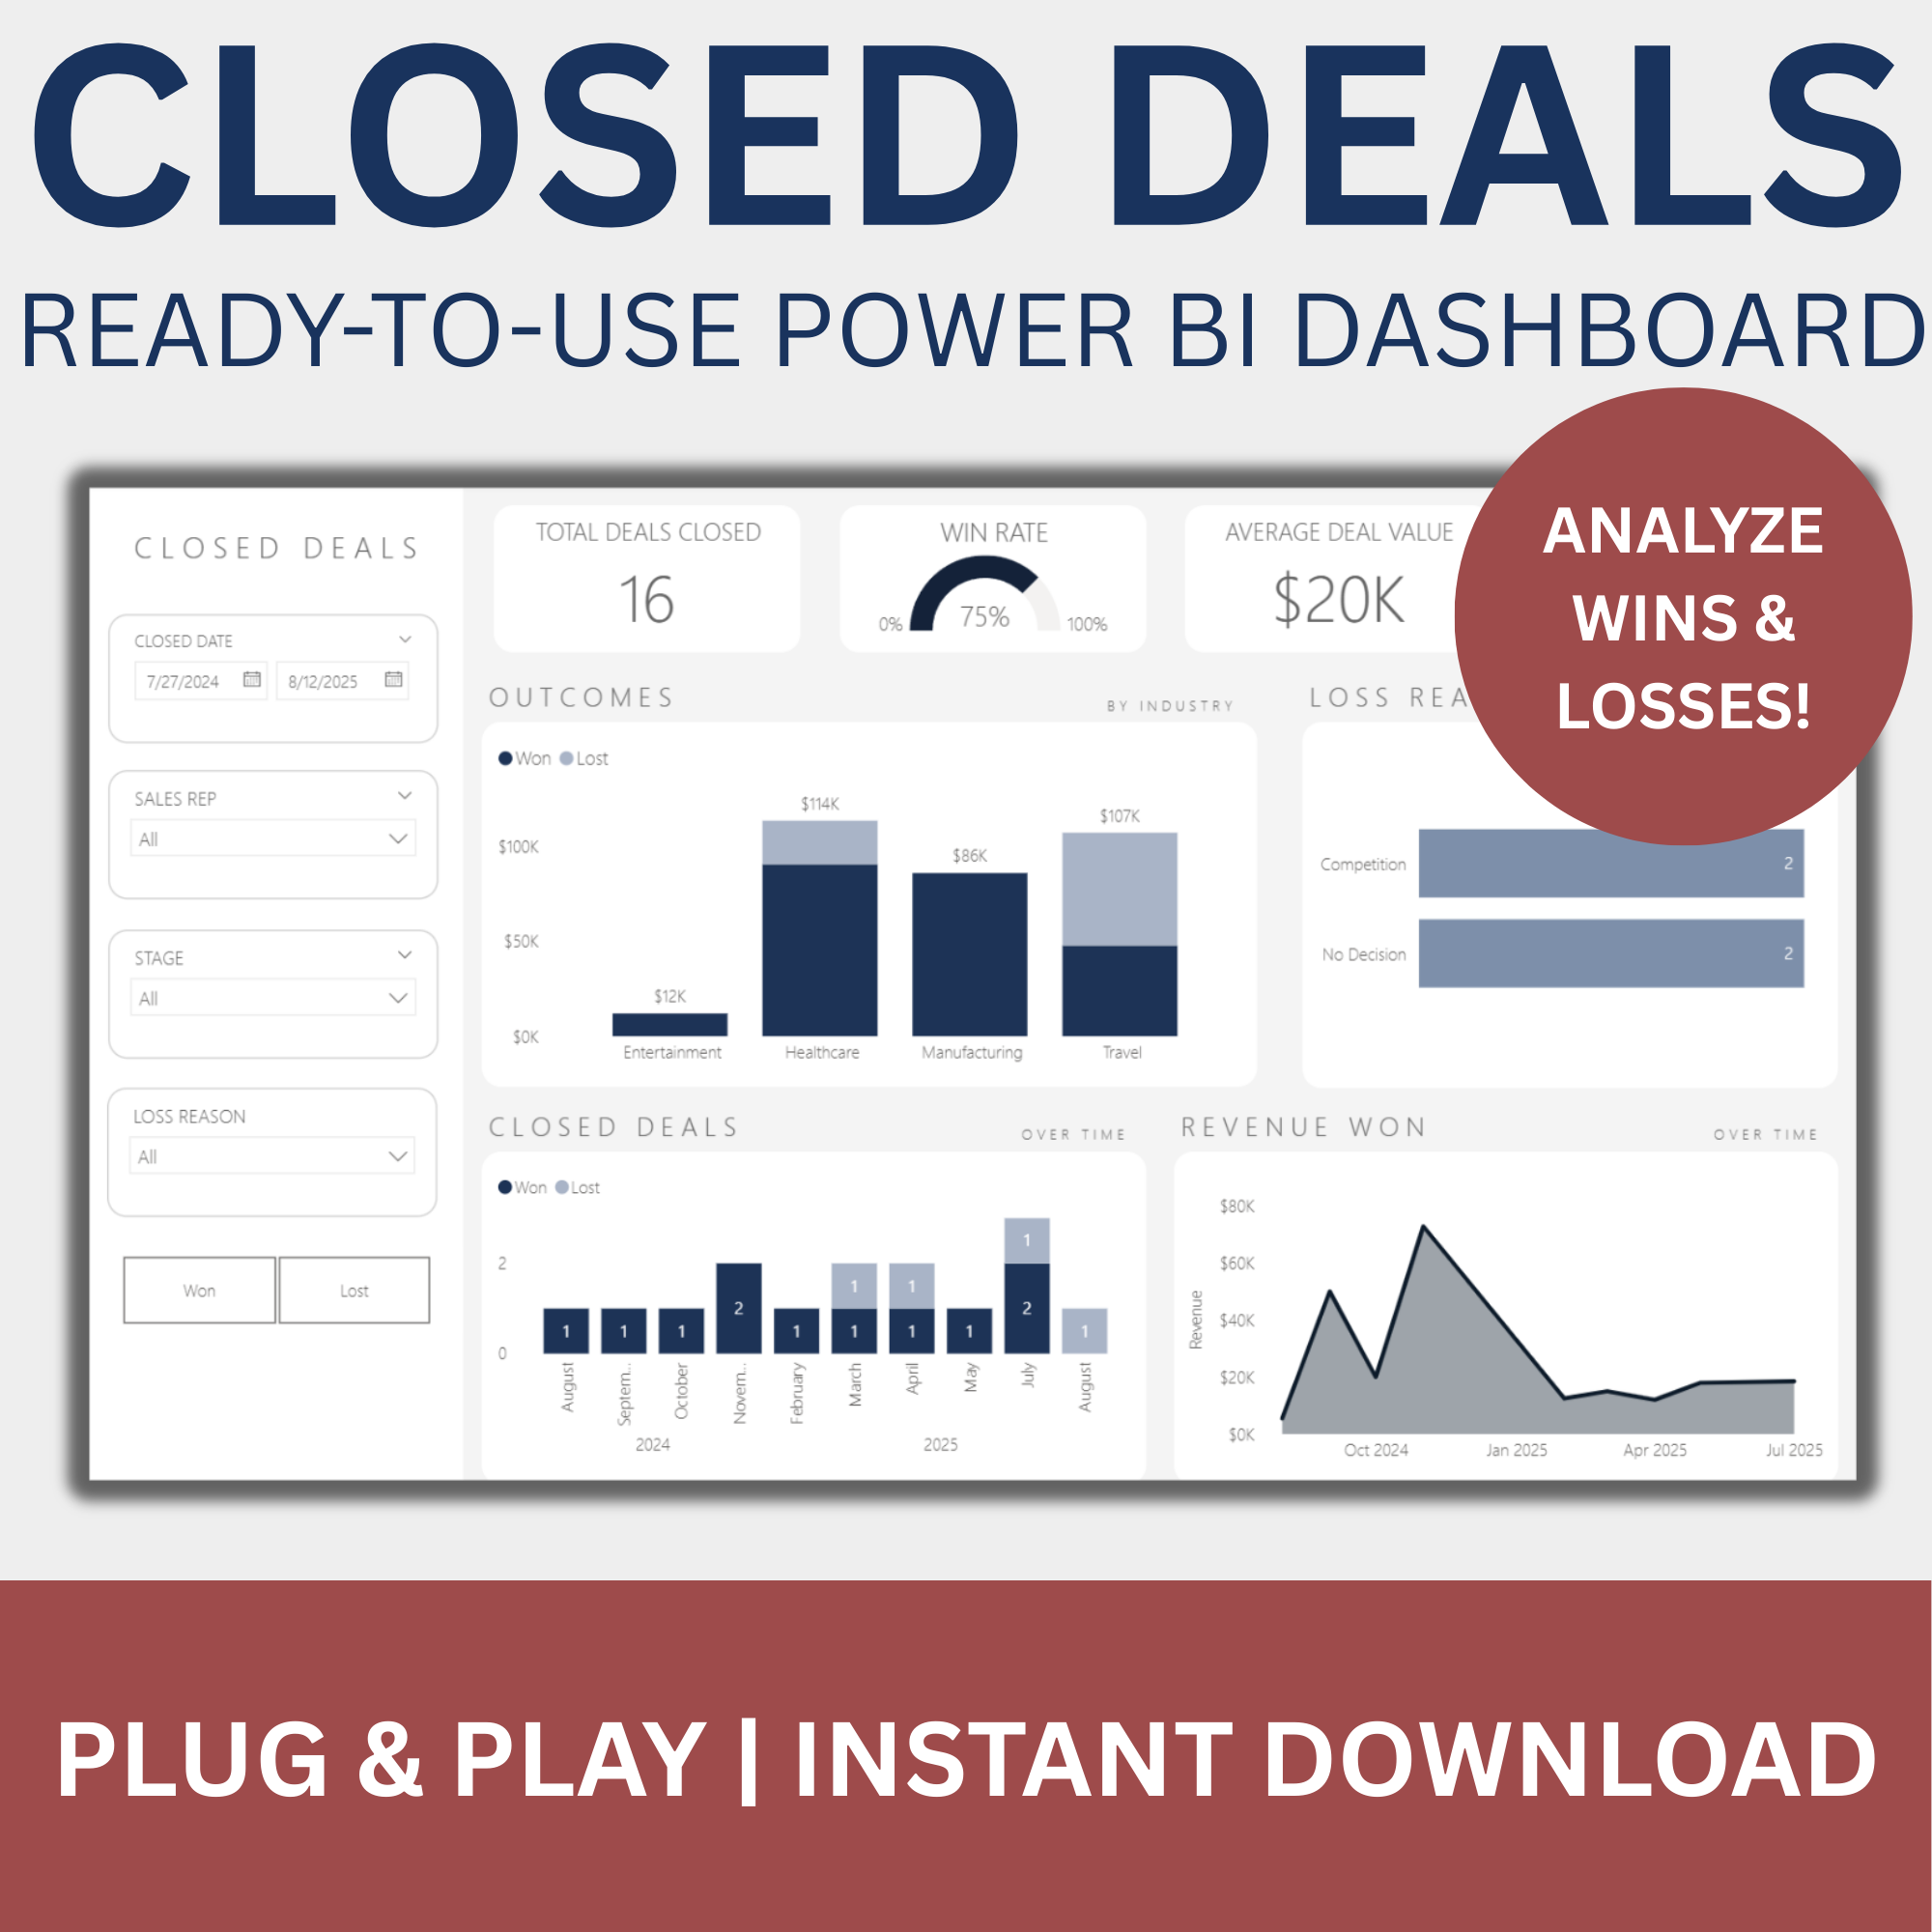 Image 2 of 2
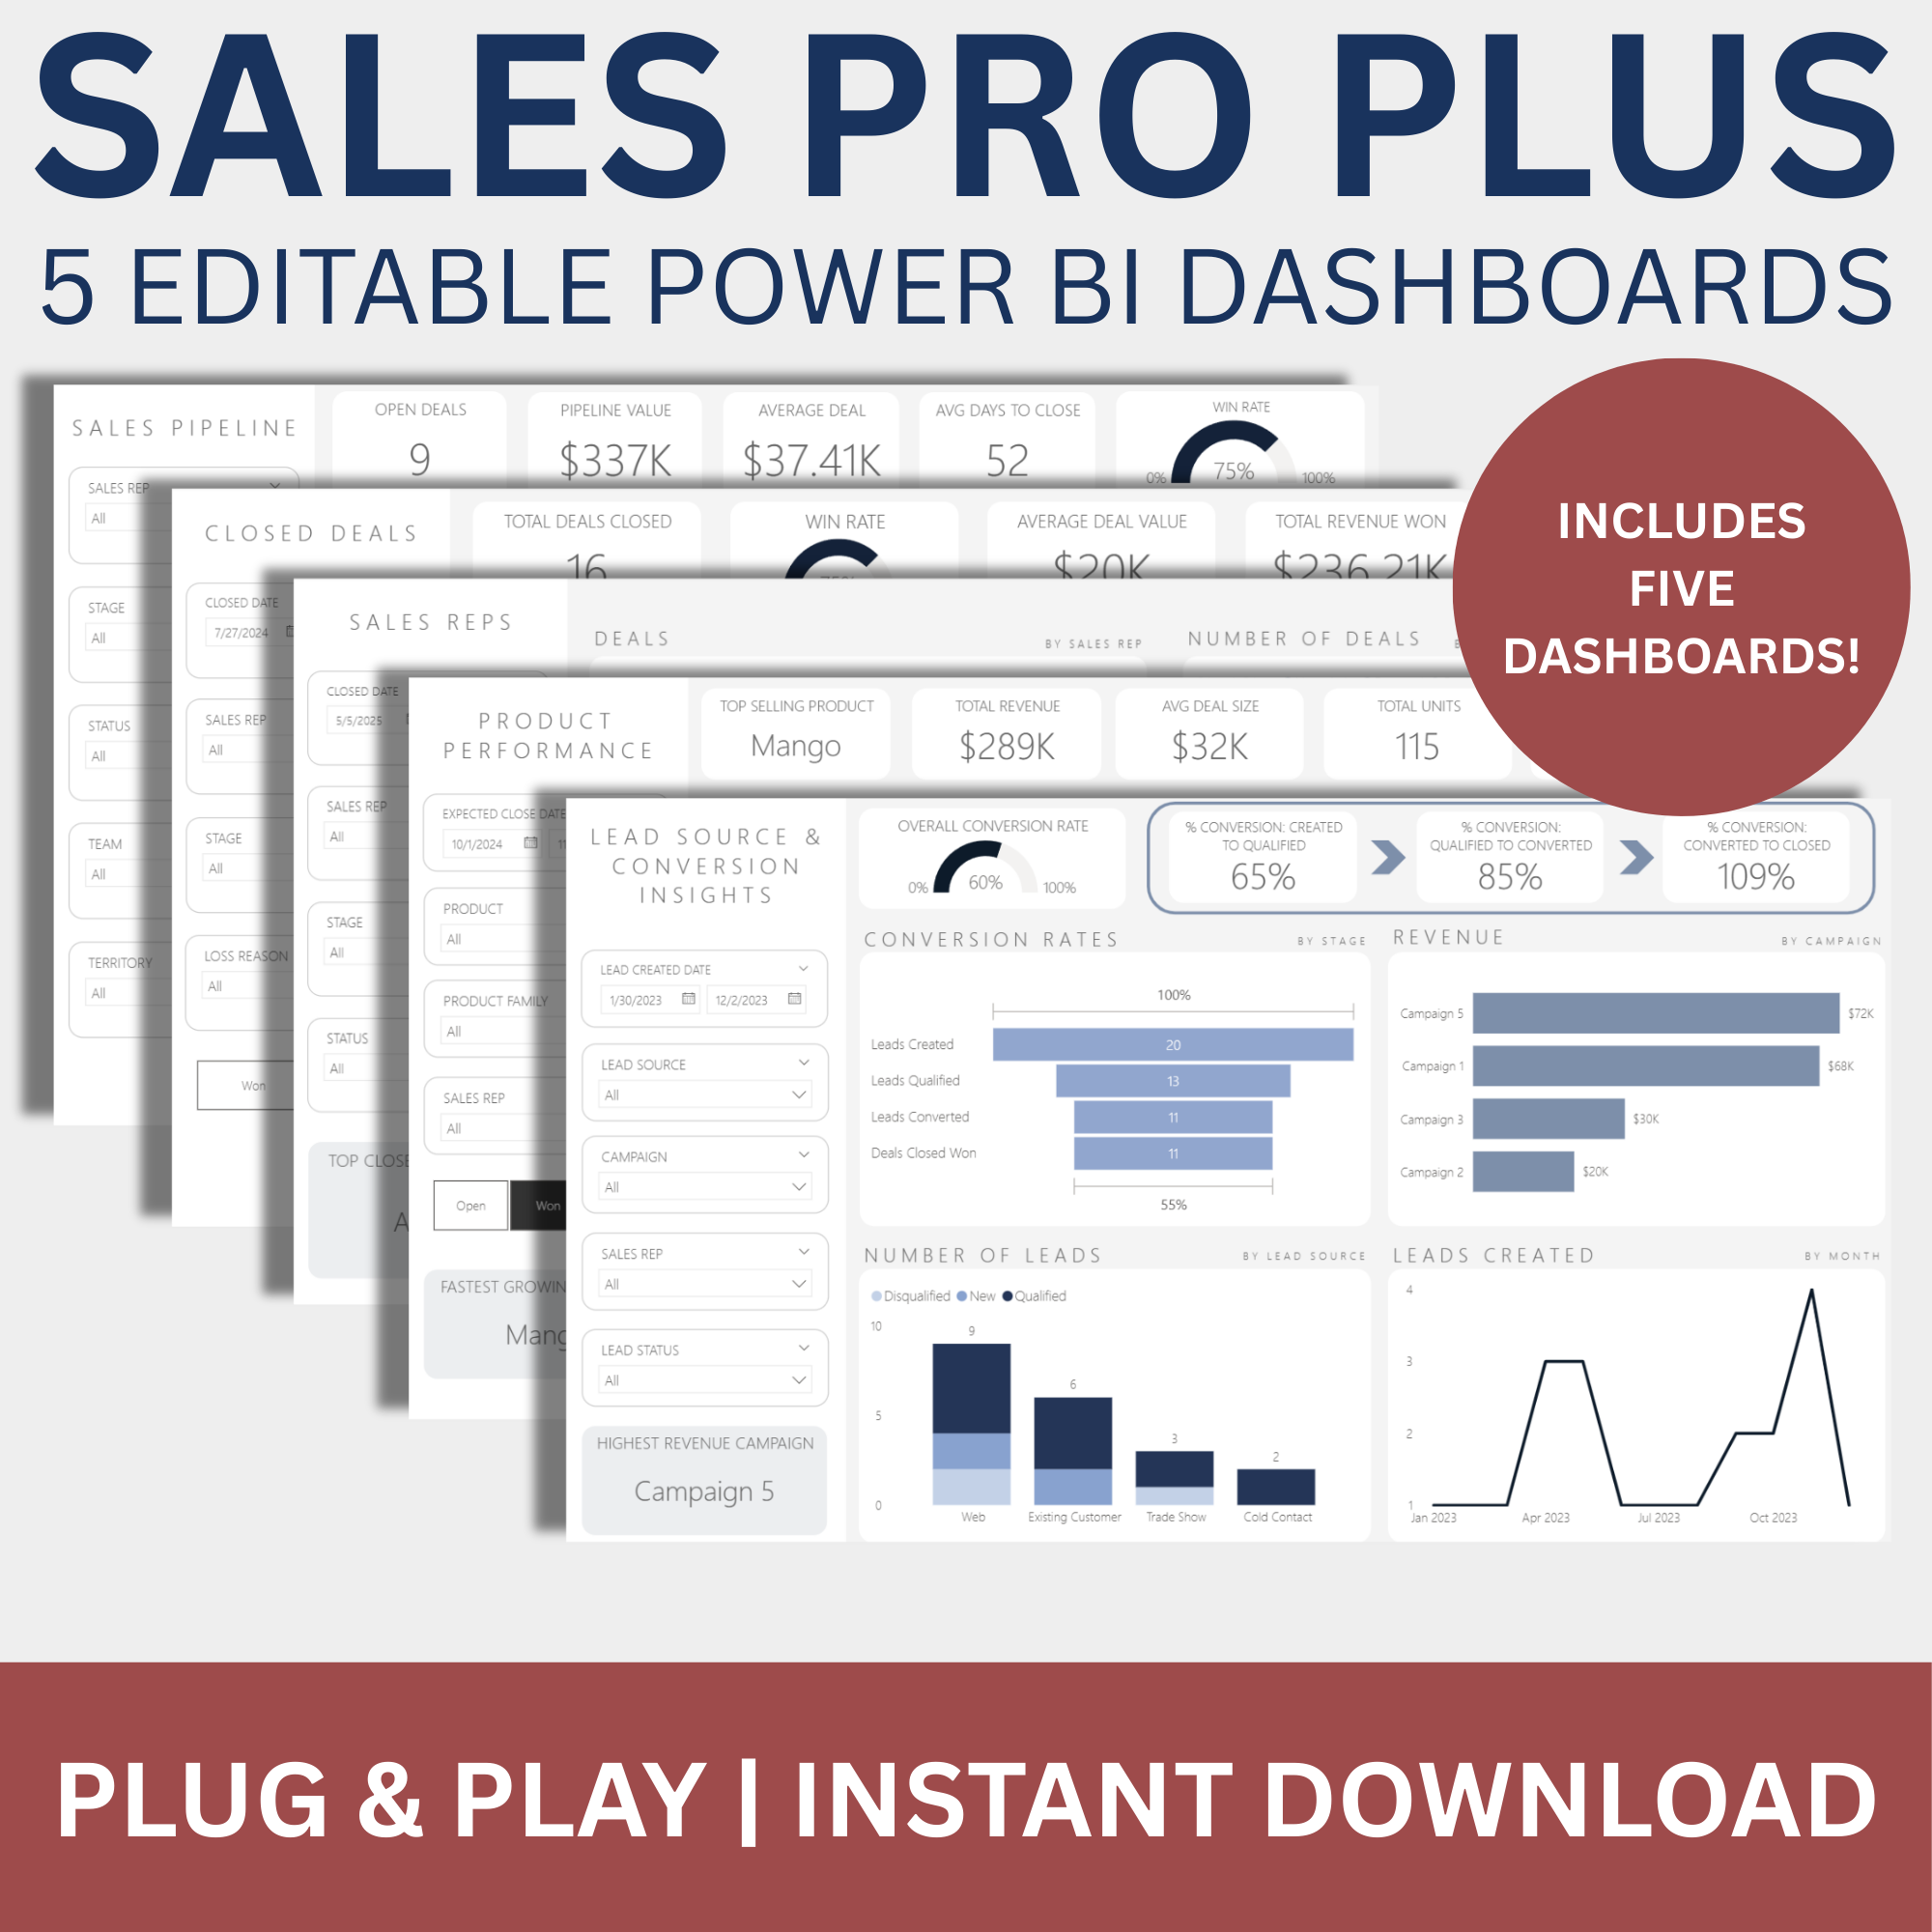
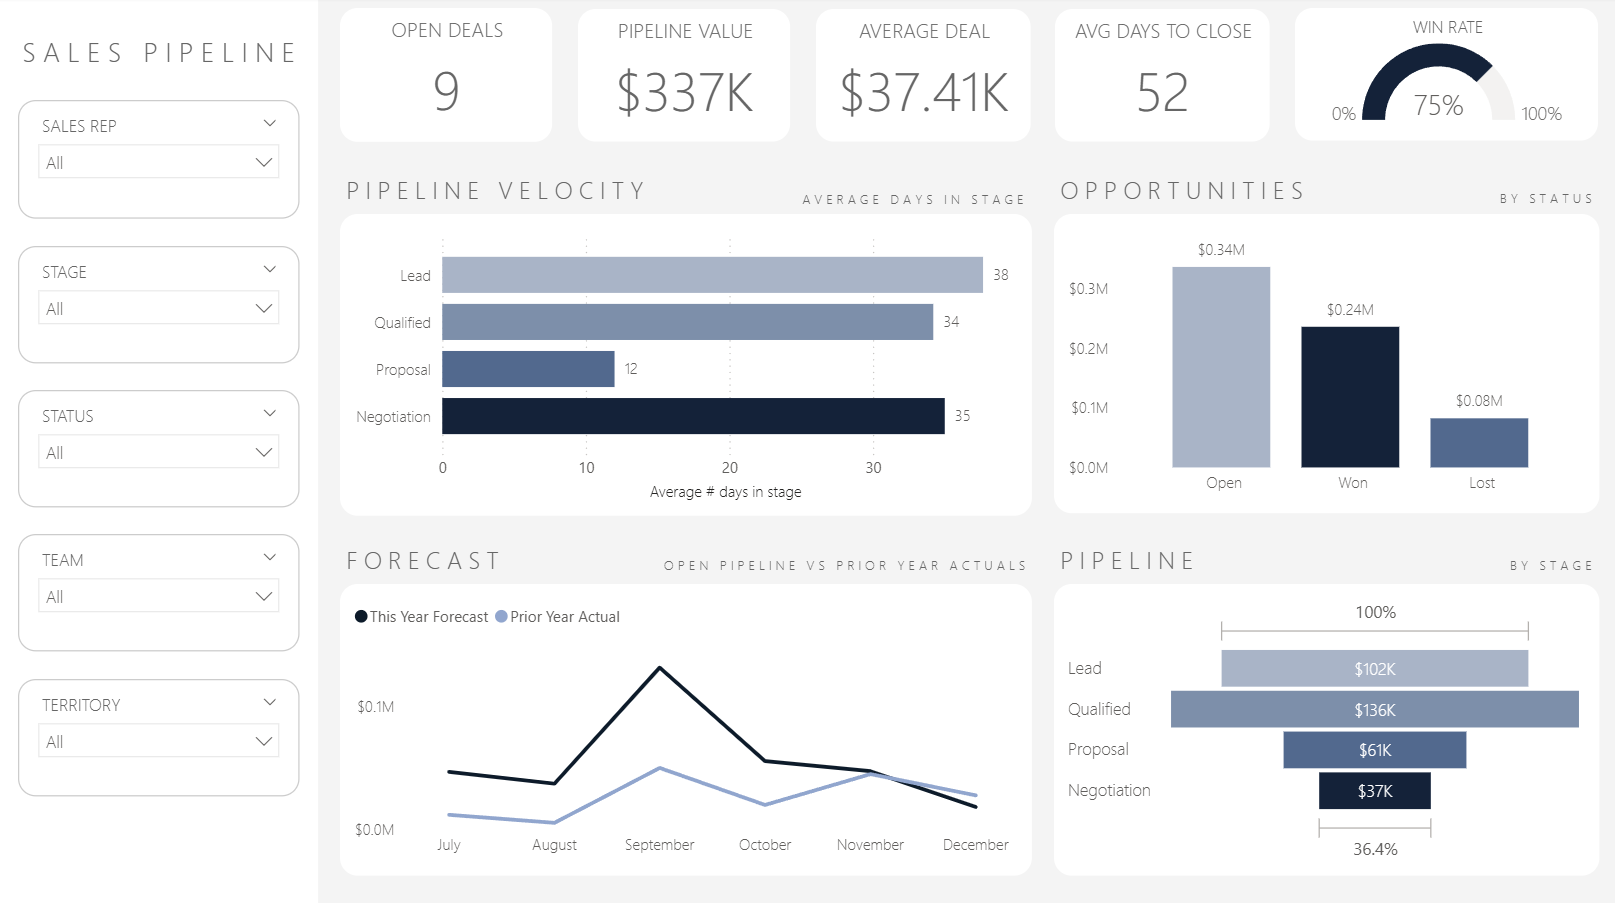
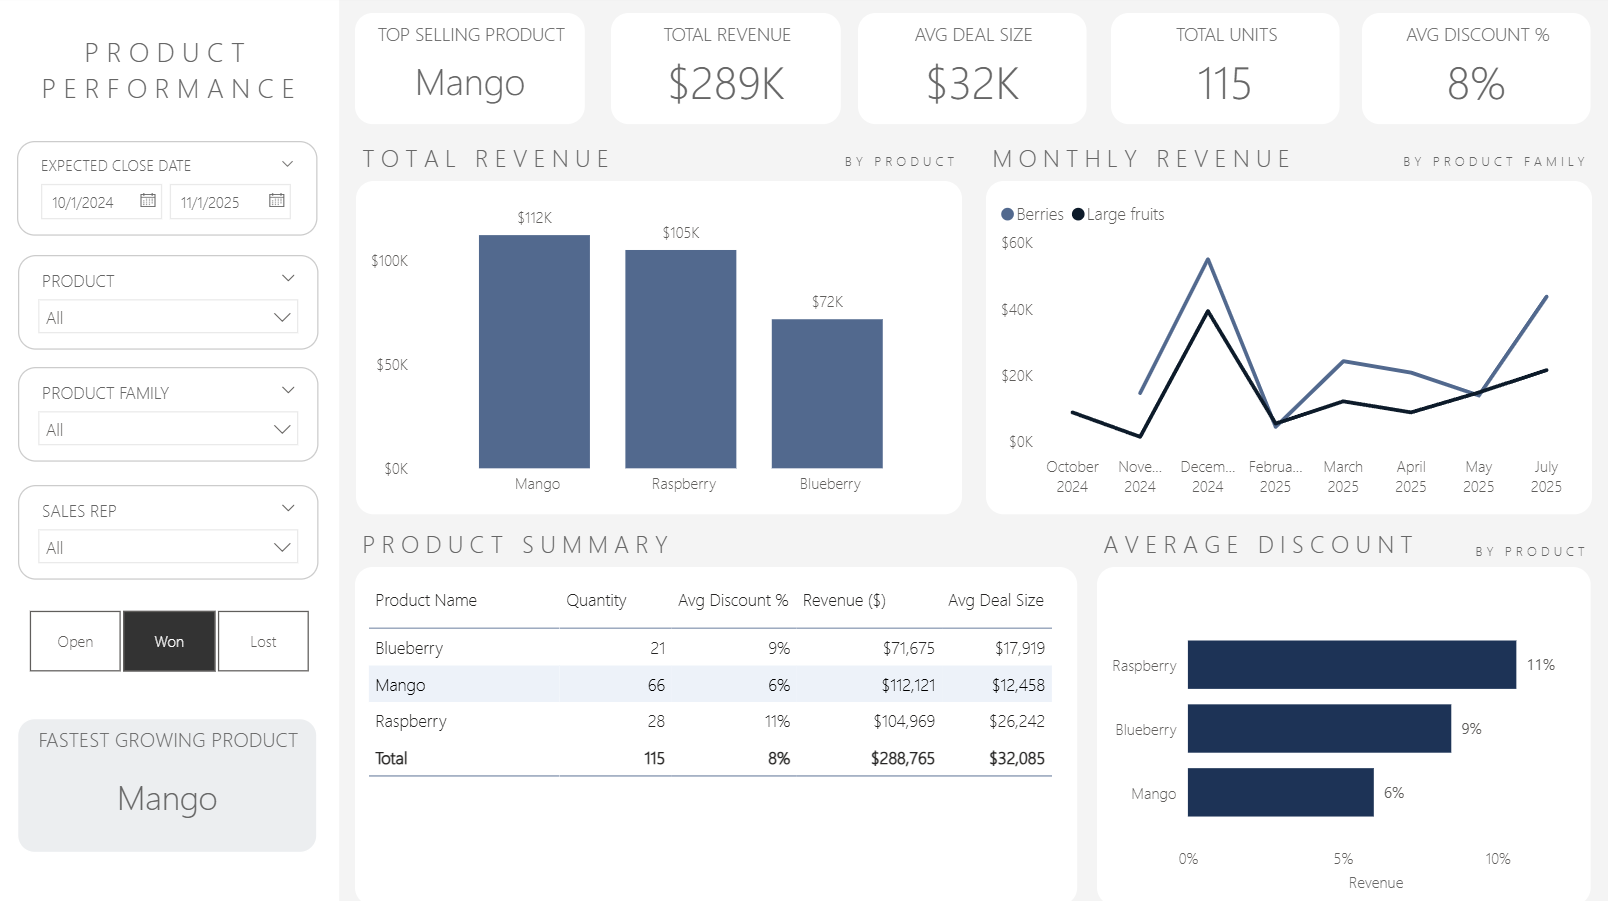
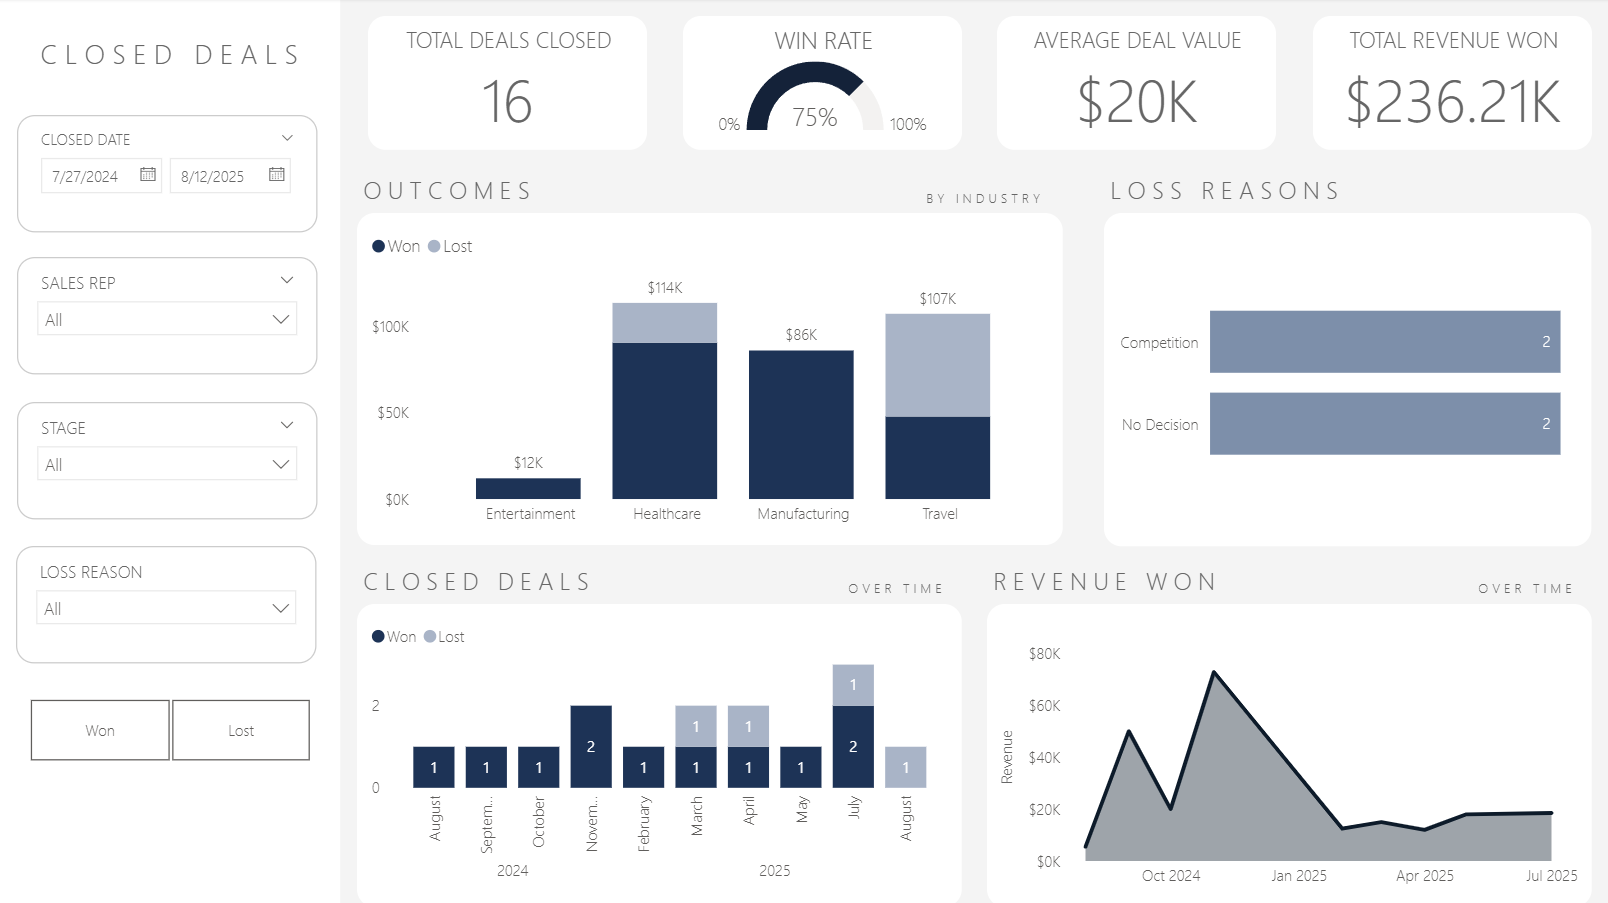
Unlock powerful insights into your sales outcomes with the Closed Deals Dashboard. This dashboard helps you analyze won and lost deals over time, by sales rep, by industry, and by reason—so you can optimize your strategy, close more business, and learn from every outcome.
Whether you're leading a sales team or reviewing your own performance, this dashboard gives you a data-driven lens into revenue trends, win rates, and what’s causing deals to slip away.
Instant Digital Download — Your dashboard will be delivered to your email immediately after checkout. No waiting, no shipping.
Key questions this dashboard answers:
How many deals have we closed, and what is our win rate?
What’s the total revenue won and average deal size?
What industries are driving the most closed revenue?
Why are we losing deals—and how often?
Which months had the highest win/loss activity?
Actionable insights you’ll gain:
Identify common loss reasons and uncover improvement areas
Compare won/lost deals by stage, rep, or industry
Monitor revenue performance over time
Validate your sales approach with win-rate and deal value data
Refine targeting based on high-performing industries
What You Get:
Power BI (.pbix) dashboard file
Excel data source
Data dictionary
Setup guide
Commercial use license
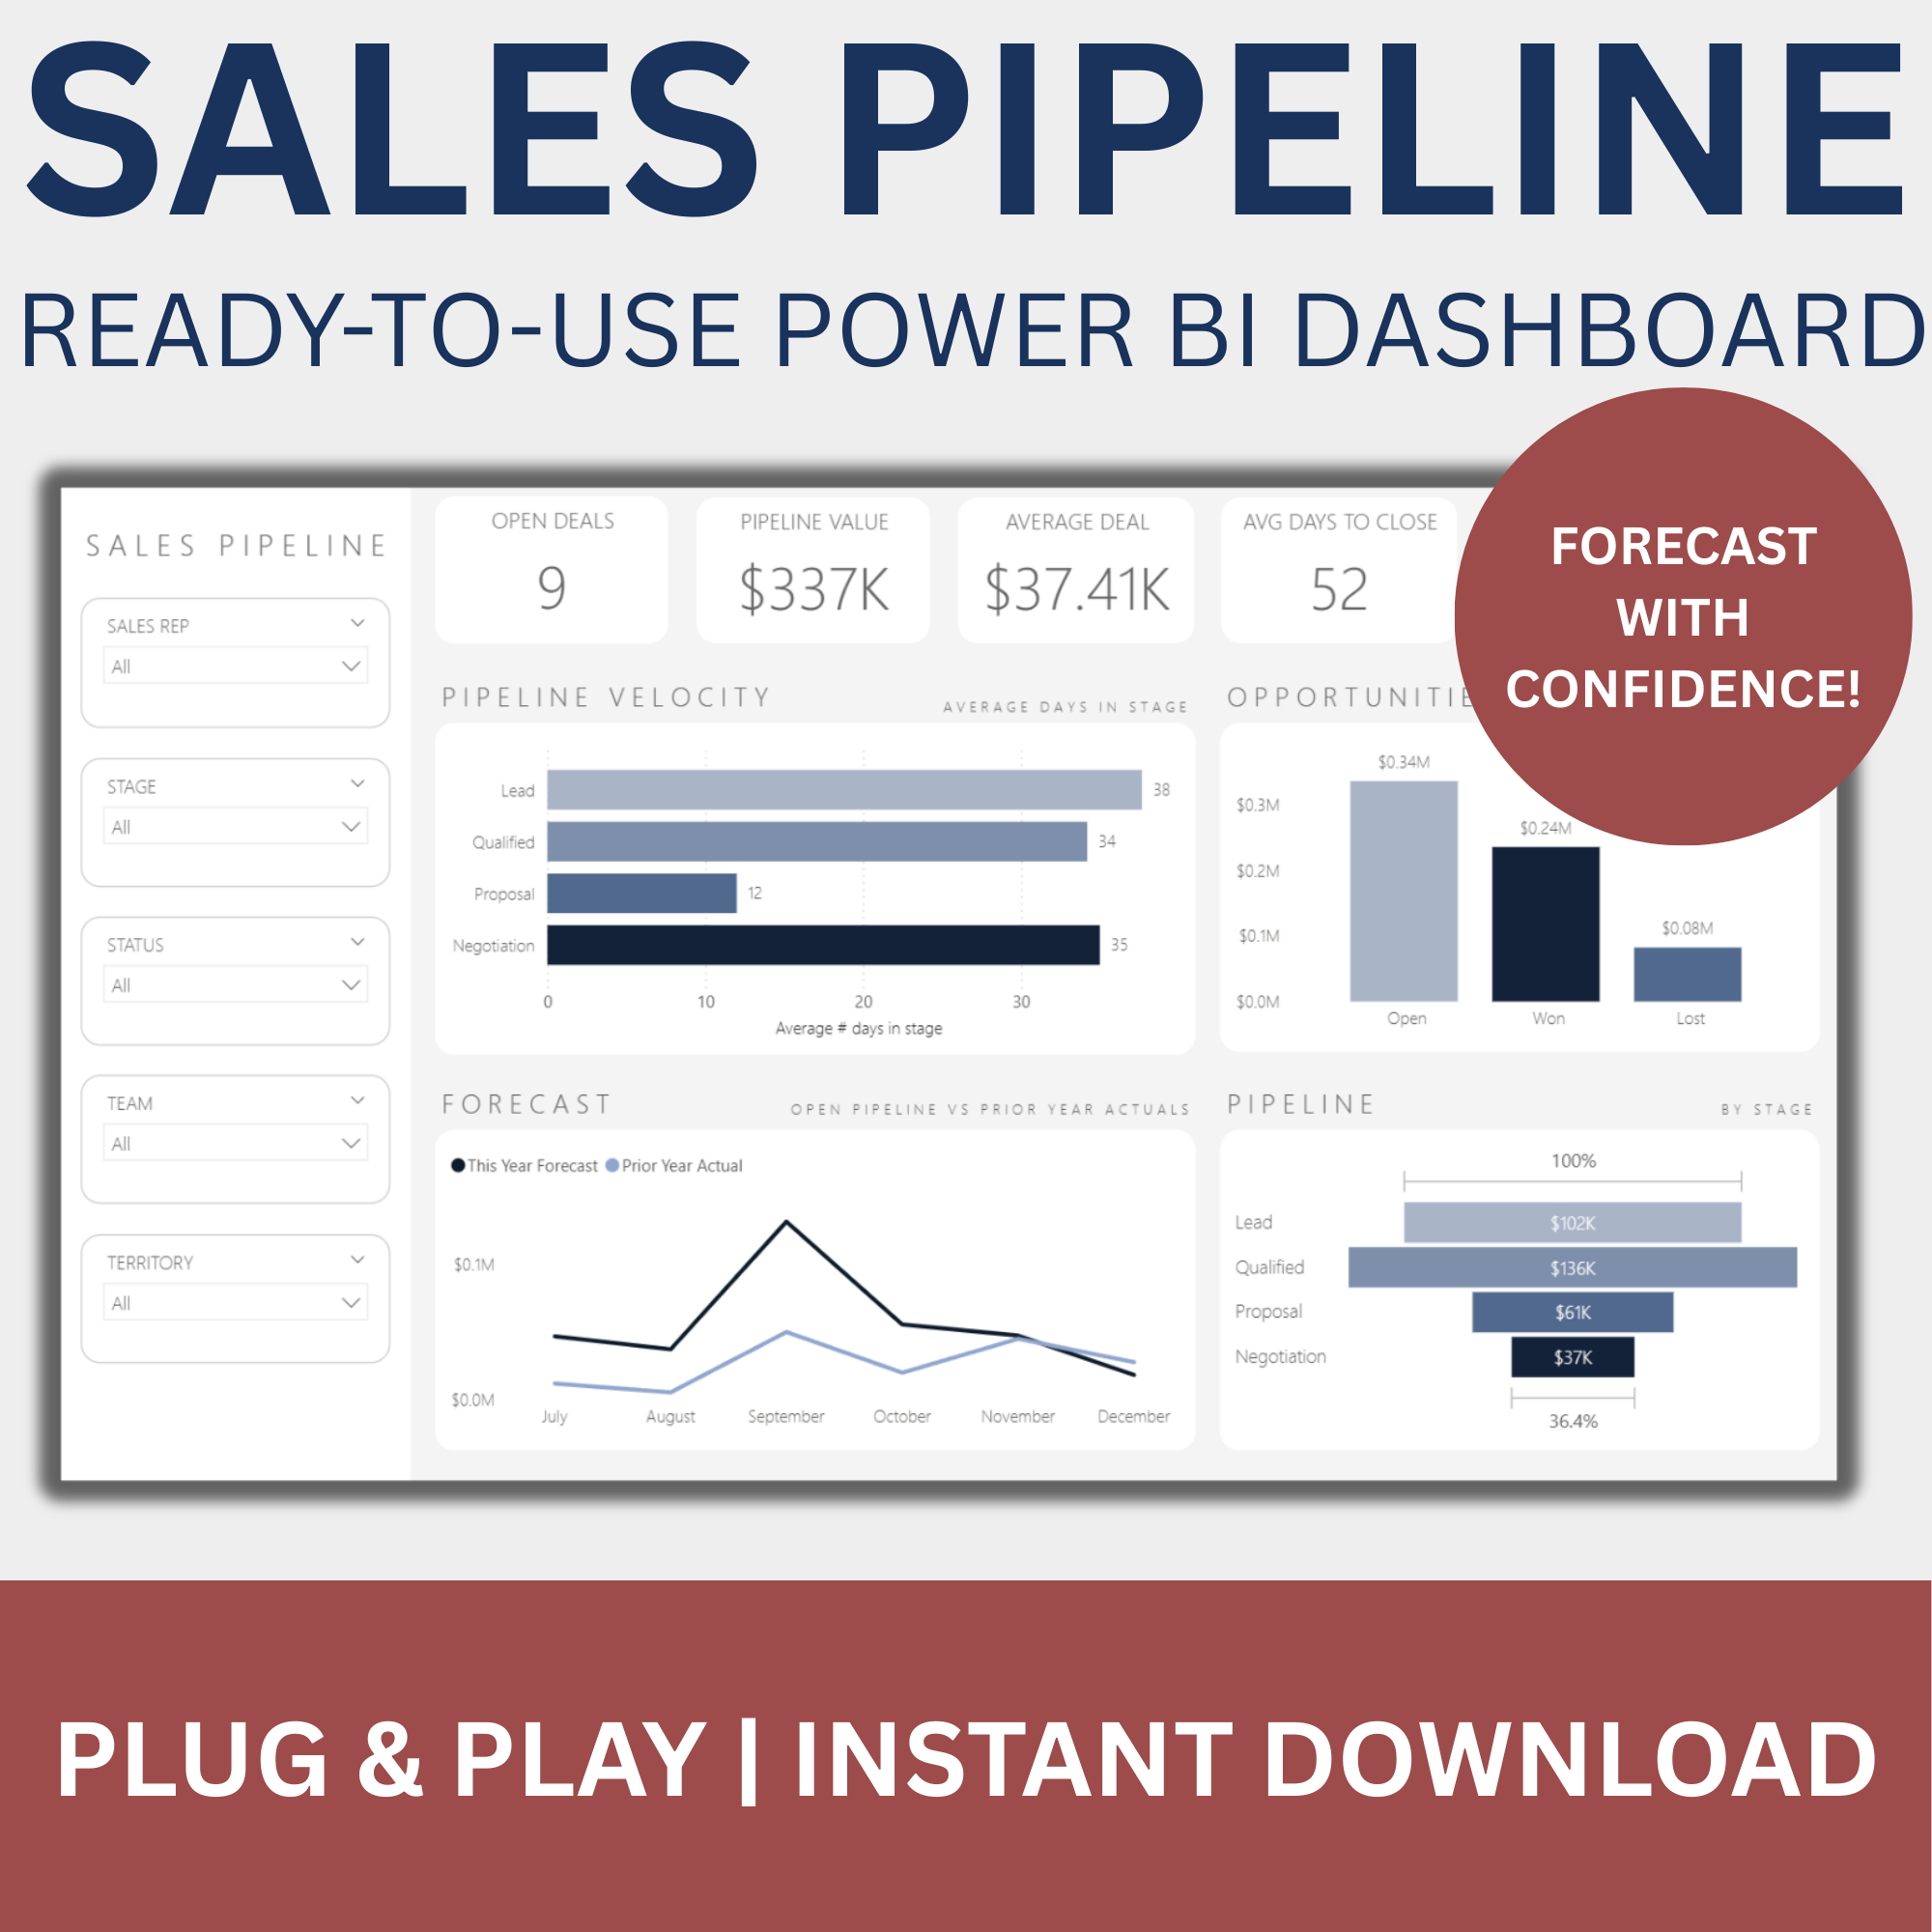
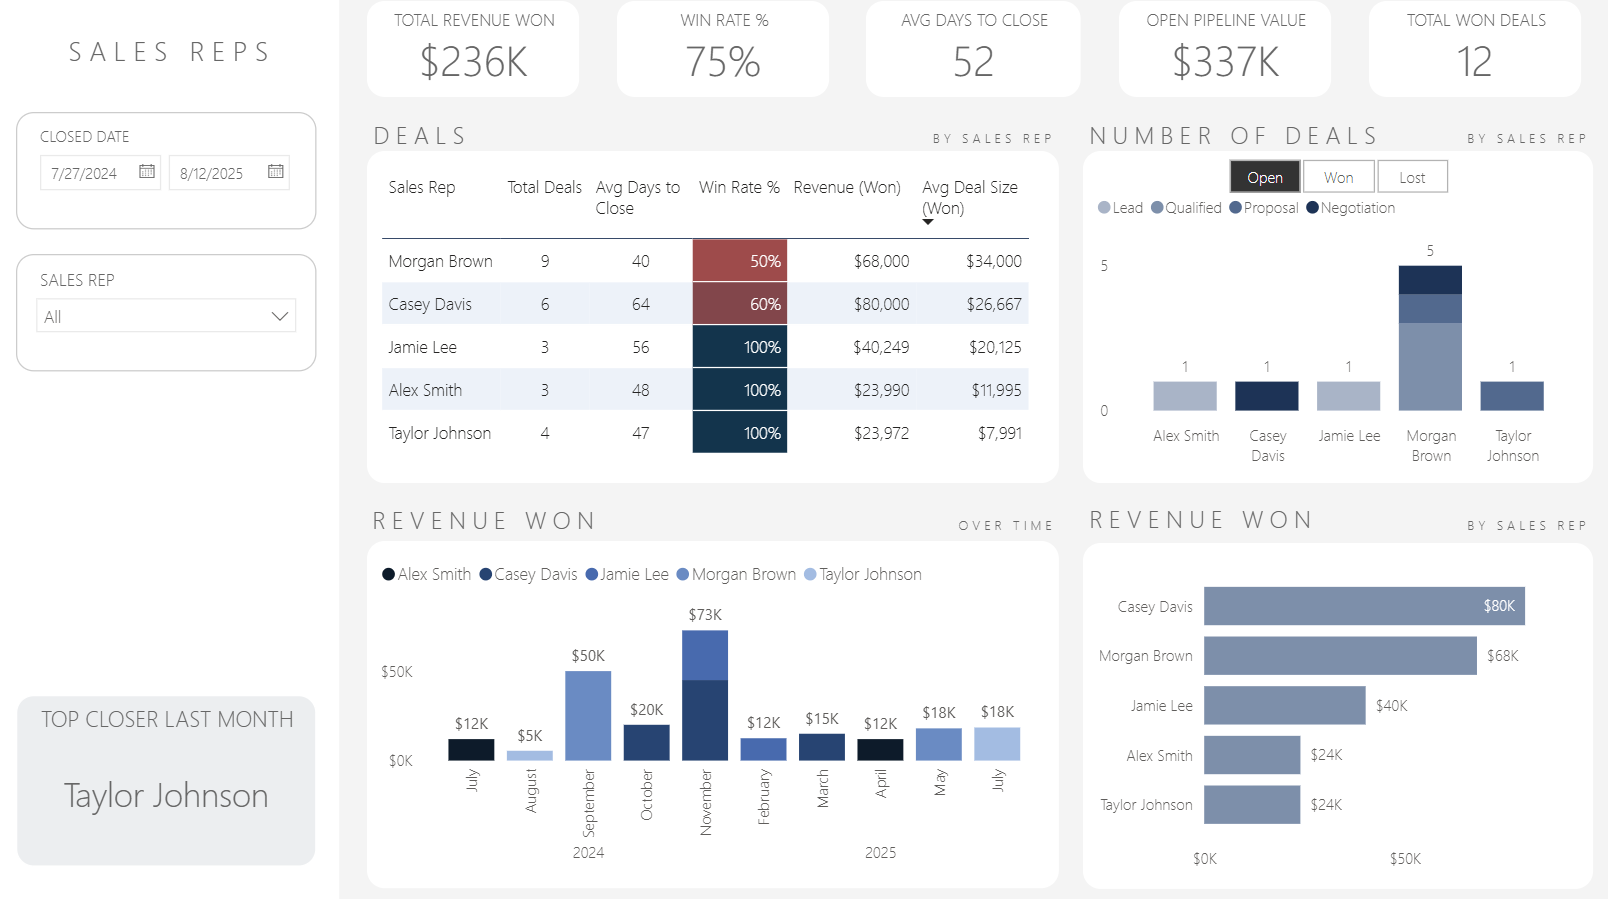
With powerful filters for Sales Rep, Stage, Closed Date, and Loss Reason, this dashboard makes it easy to drill into what’s working—and what’s not—so you can continuously refine your sales approach.
Ideal for sales managers, individual reps, or sales ops teams focused on post-mortem analysis and performance improvement.
Unlock powerful insights into your sales outcomes with the Closed Deals Dashboard. This dashboard helps you analyze won and lost deals over time, by sales rep, by industry, and by reason—so you can optimize your strategy, close more business, and learn from every outcome.
Whether you're leading a sales team or reviewing your own performance, this dashboard gives you a data-driven lens into revenue trends, win rates, and what’s causing deals to slip away.
Instant Digital Download — Your dashboard will be delivered to your email immediately after checkout. No waiting, no shipping.
Key questions this dashboard answers:
How many deals have we closed, and what is our win rate?
What’s the total revenue won and average deal size?
What industries are driving the most closed revenue?
Why are we losing deals—and how often?
Which months had the highest win/loss activity?
Actionable insights you’ll gain:
Identify common loss reasons and uncover improvement areas
Compare won/lost deals by stage, rep, or industry
Monitor revenue performance over time
Validate your sales approach with win-rate and deal value data
Refine targeting based on high-performing industries
What You Get:
Power BI (.pbix) dashboard file
Excel data source
Data dictionary
Setup guide
Commercial use license
With powerful filters for Sales Rep, Stage, Closed Date, and Loss Reason, this dashboard makes it easy to drill into what’s working—and what’s not—so you can continuously refine your sales approach.
Ideal for sales managers, individual reps, or sales ops teams focused on post-mortem analysis and performance improvement.