Discover which products are driving revenue—and which need attention—with the Product Performance Dashboard in the Sales Starter Kit. This dashboard delivers a clear, data-driven view of product-level sales performance, helping you analyze total revenue, deal size, discounting, and monthly trends by product or product family.
Whether you're in sales, product management, or revenue operations, this dashboard gives you the insight you need to make smarter decisions about pricing, bundling, and go-to-market strategies.
Instant Digital Download — Your dashboard will be delivered to your email immediately after checkout. No waiting, no shipping.
Key questions this dashboard answers:
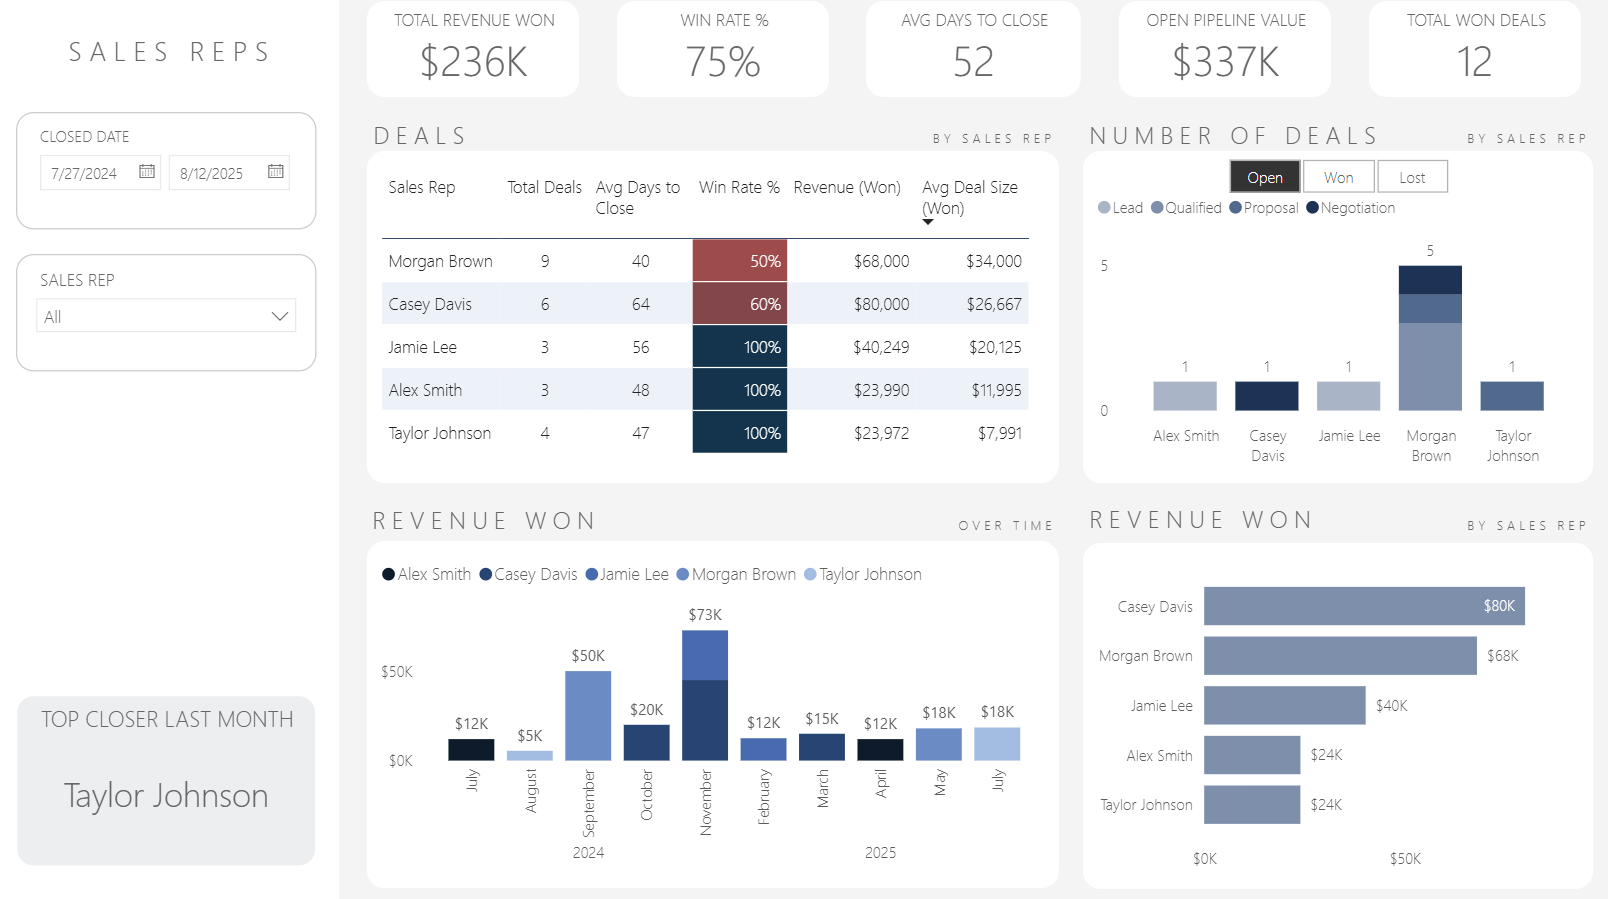
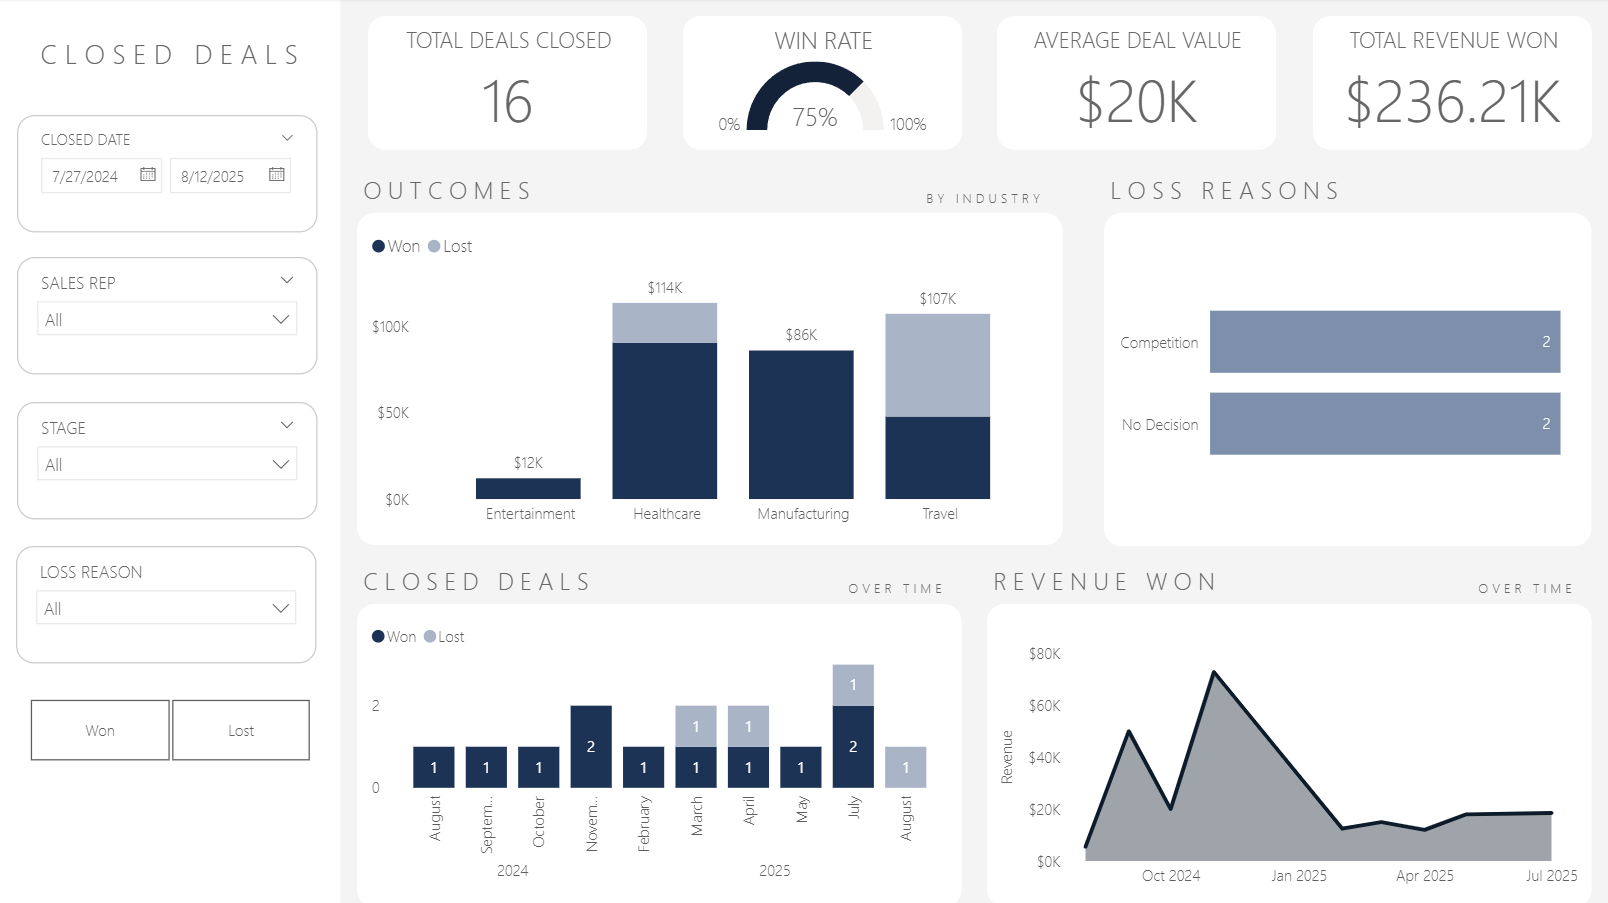
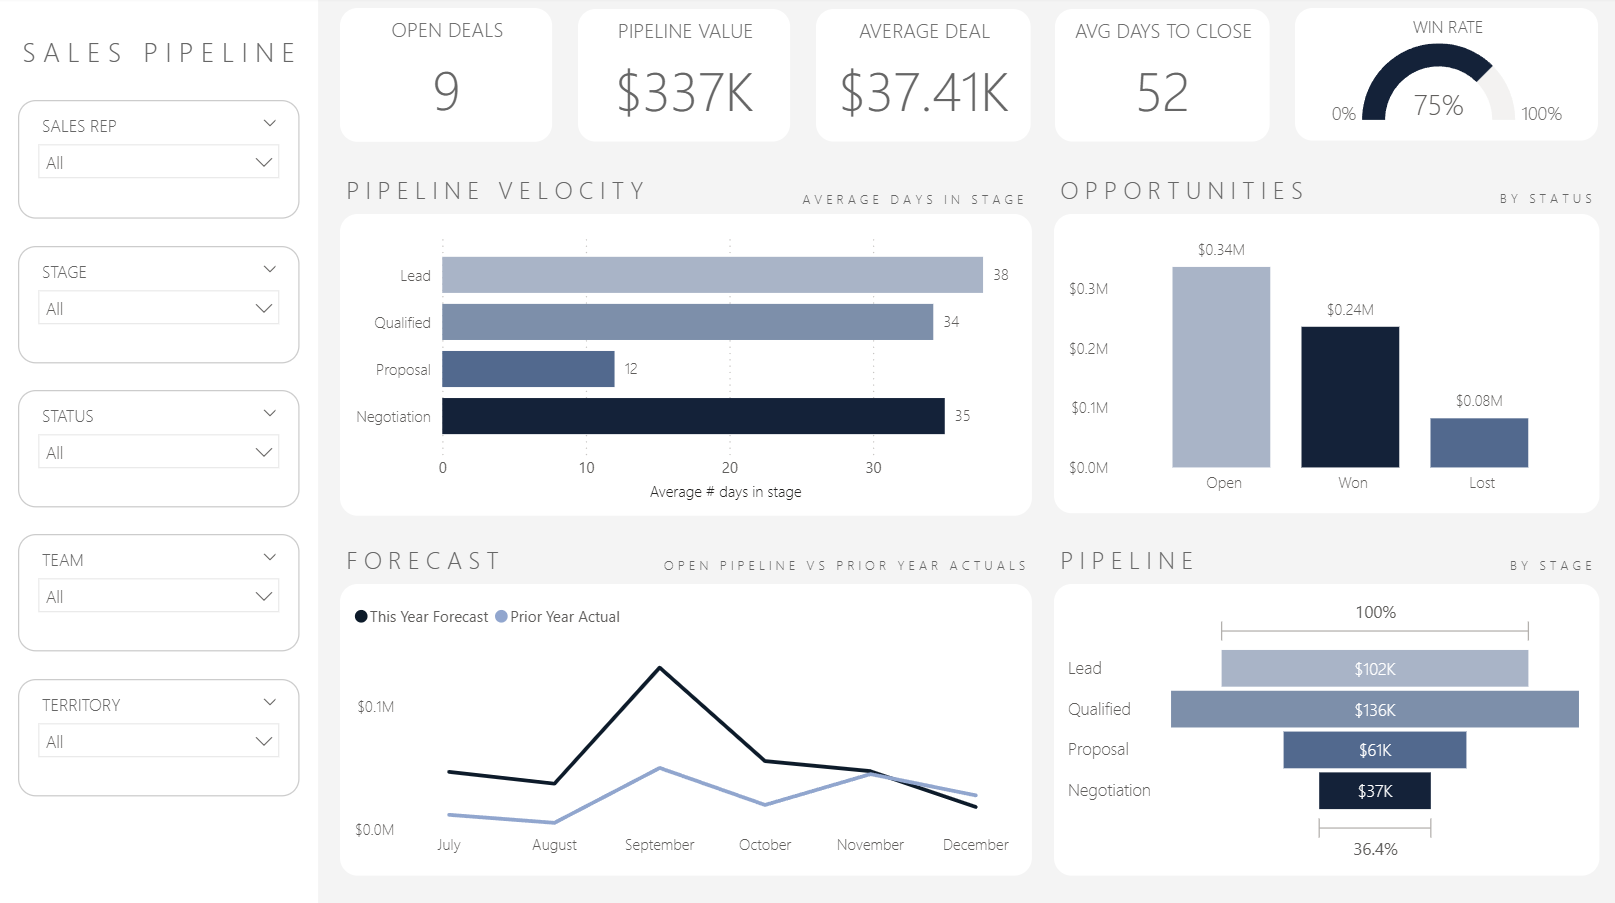
What is our top-selling product by revenue or quantity?
Which products have the highest average deal size?
What’s the average discount by product or category?
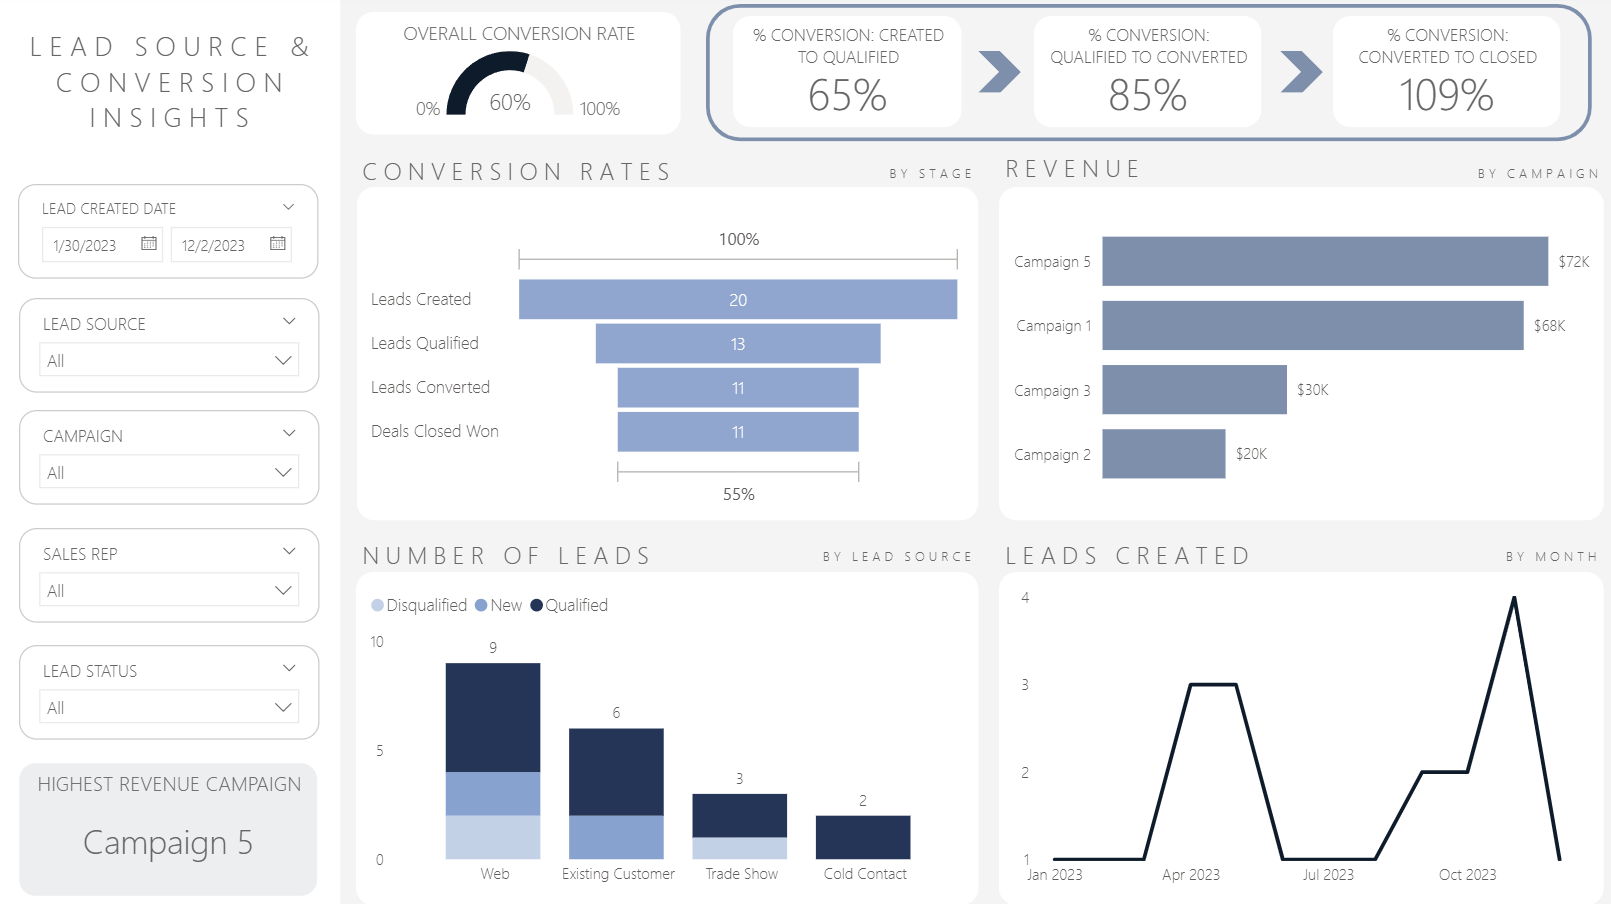
How does monthly revenue trend across product families?
Which products are growing fastest over time?
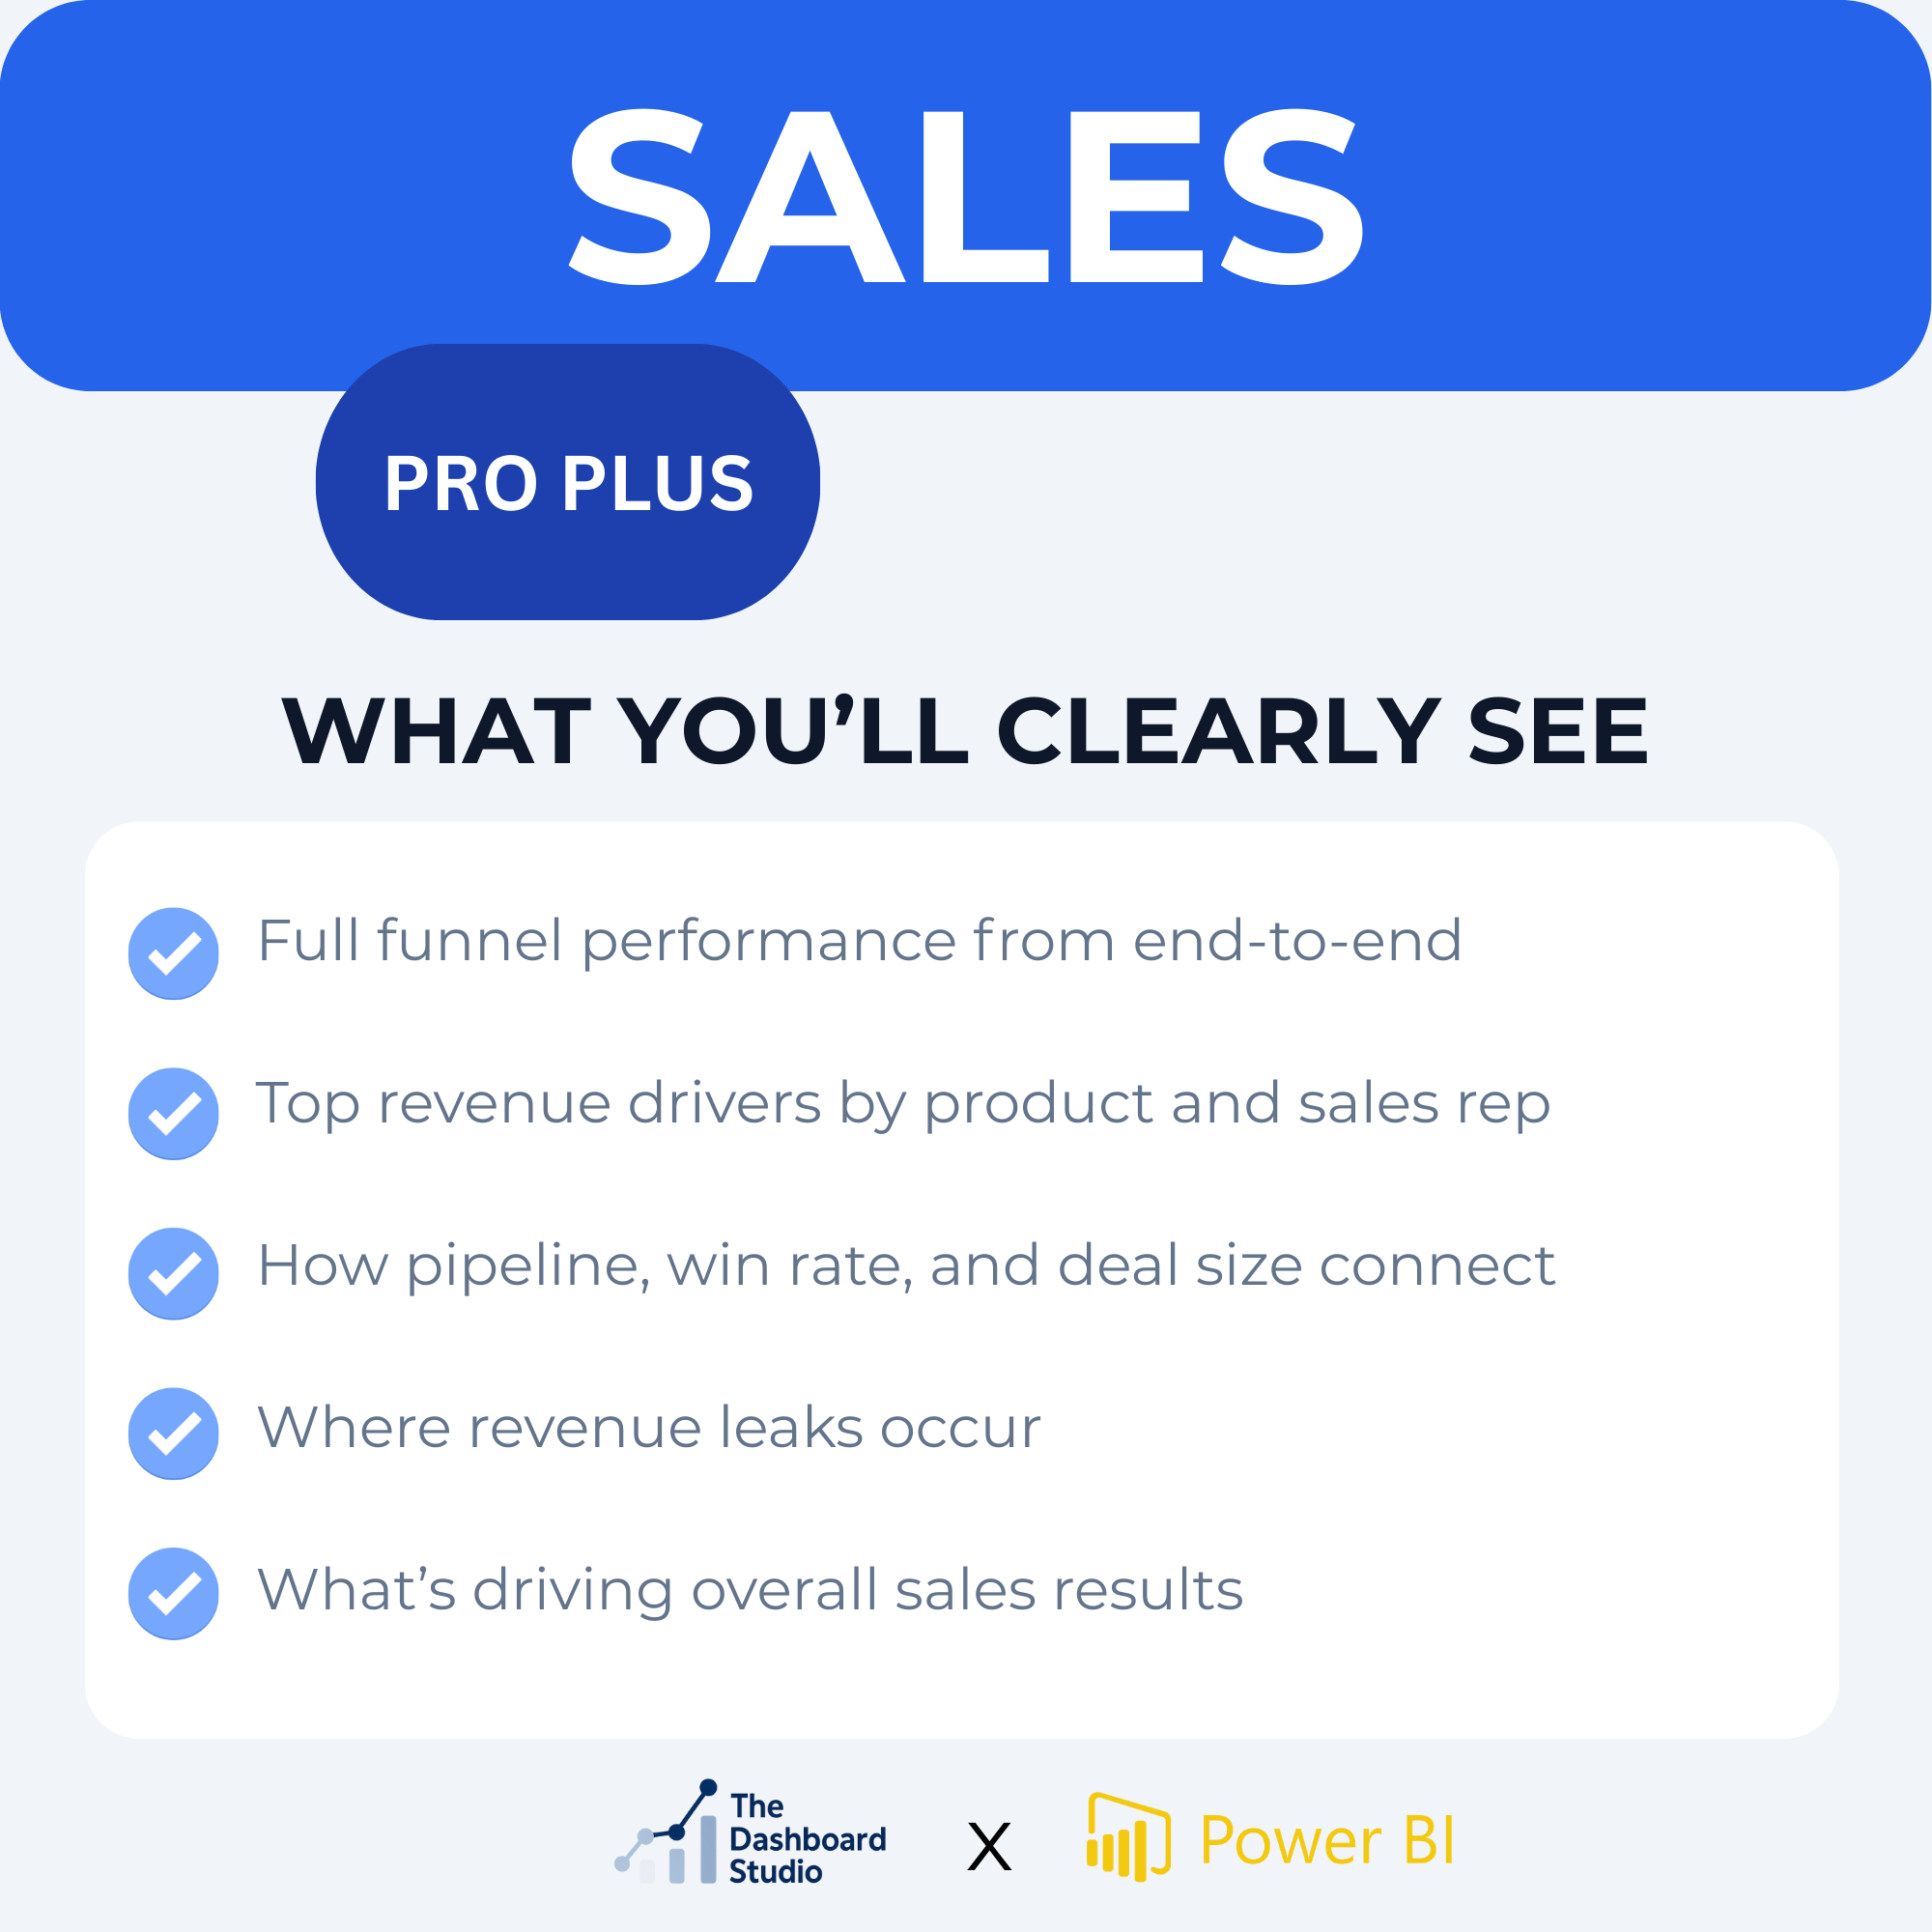
Actionable insights you’ll gain:
Identify revenue leaders and underperforming products
Track discounting trends to protect margin
Adjust pricing and bundling based on sales behavior
Spot seasonality or momentum in specific product lines
Drive cross-functional decisions across sales and product teams
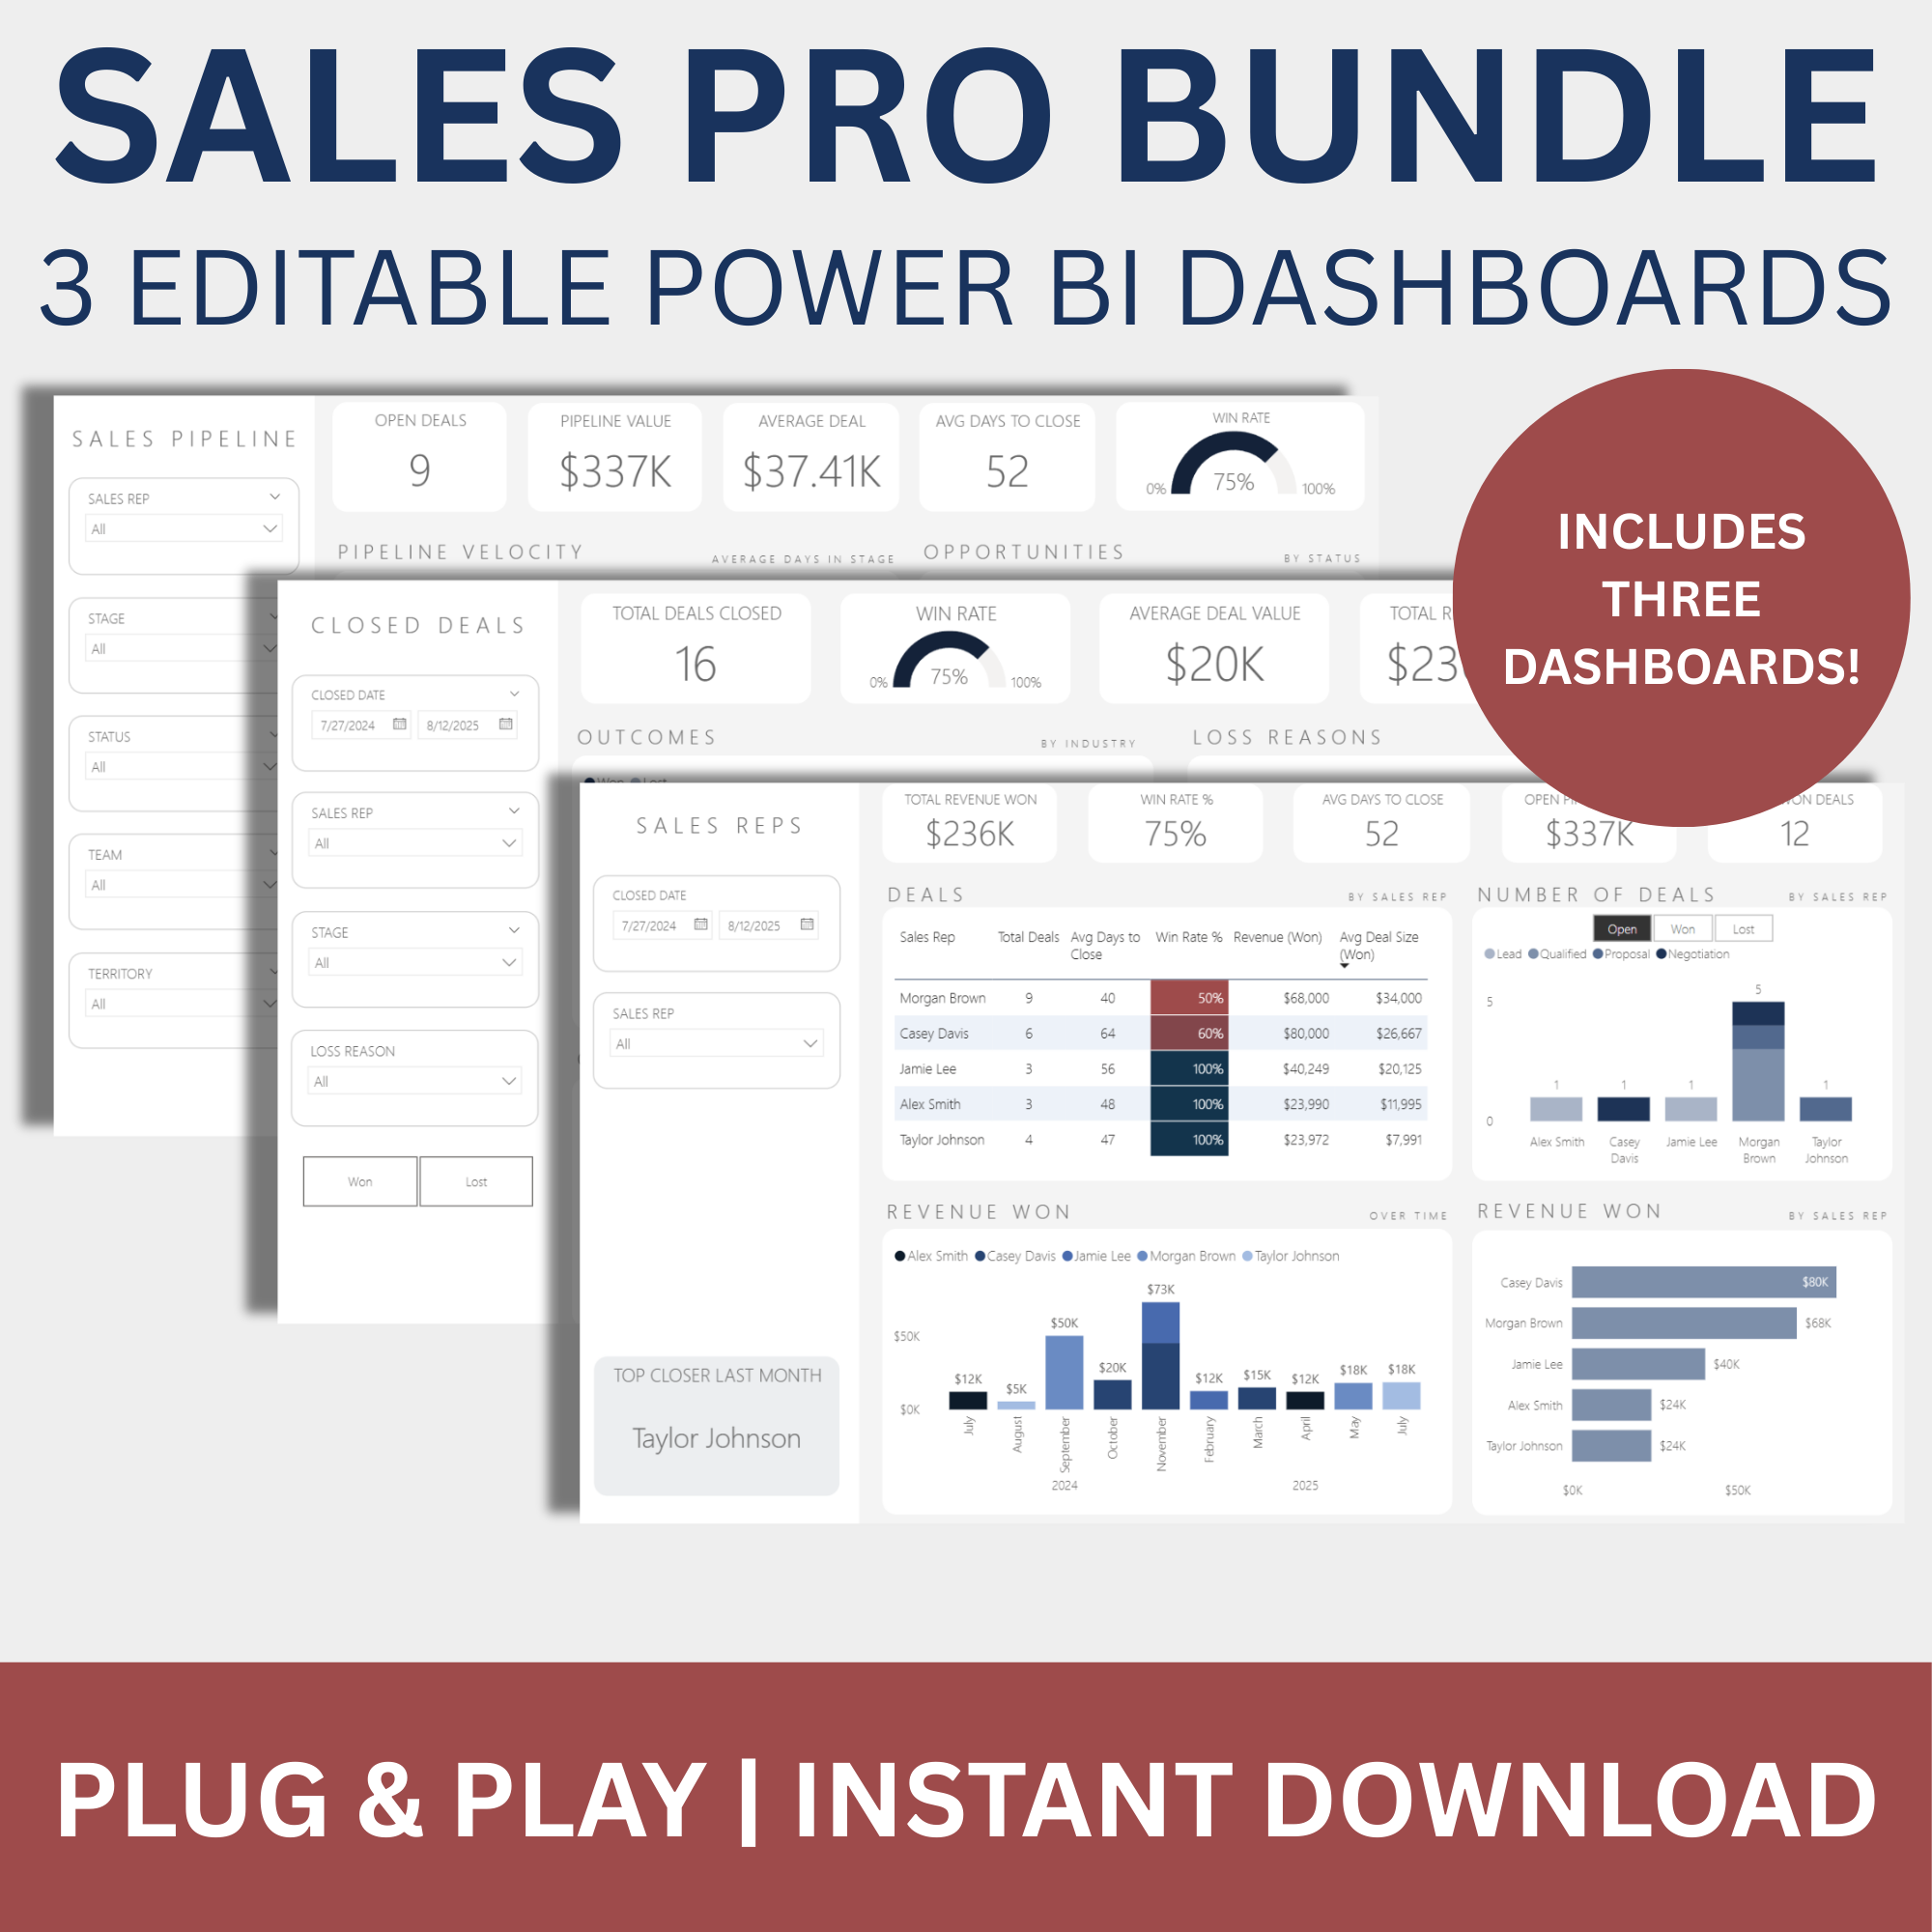
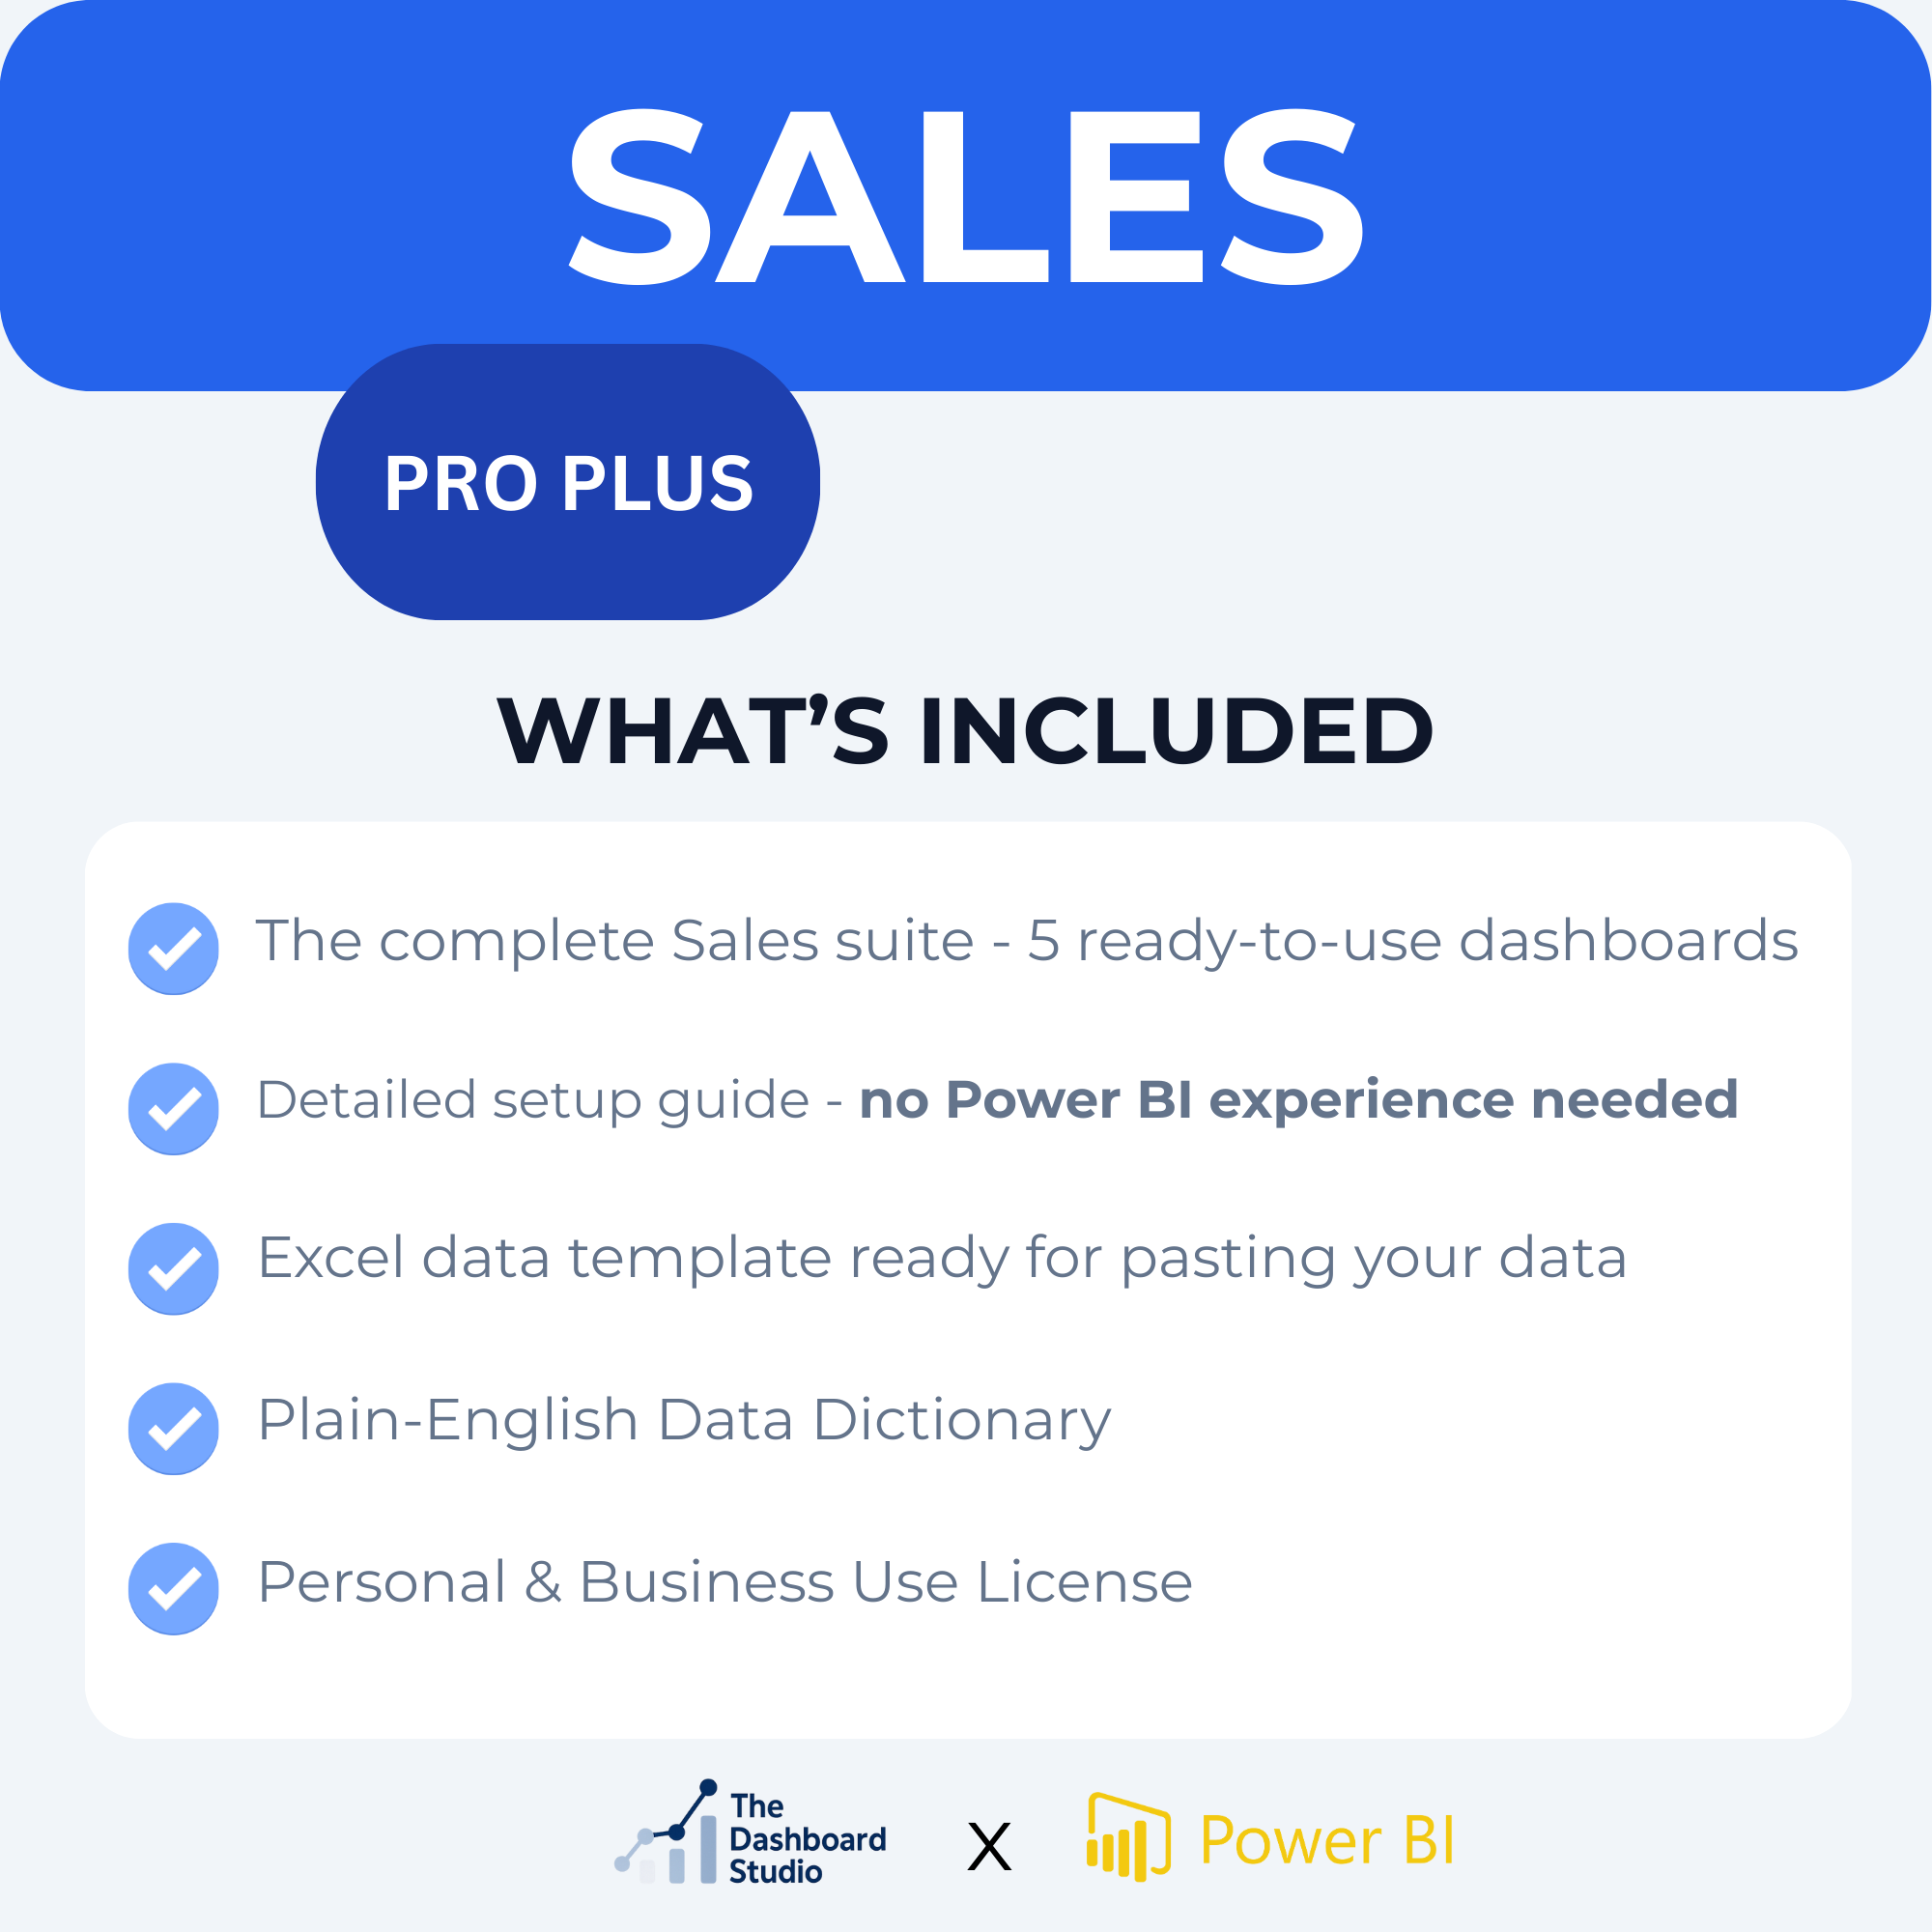
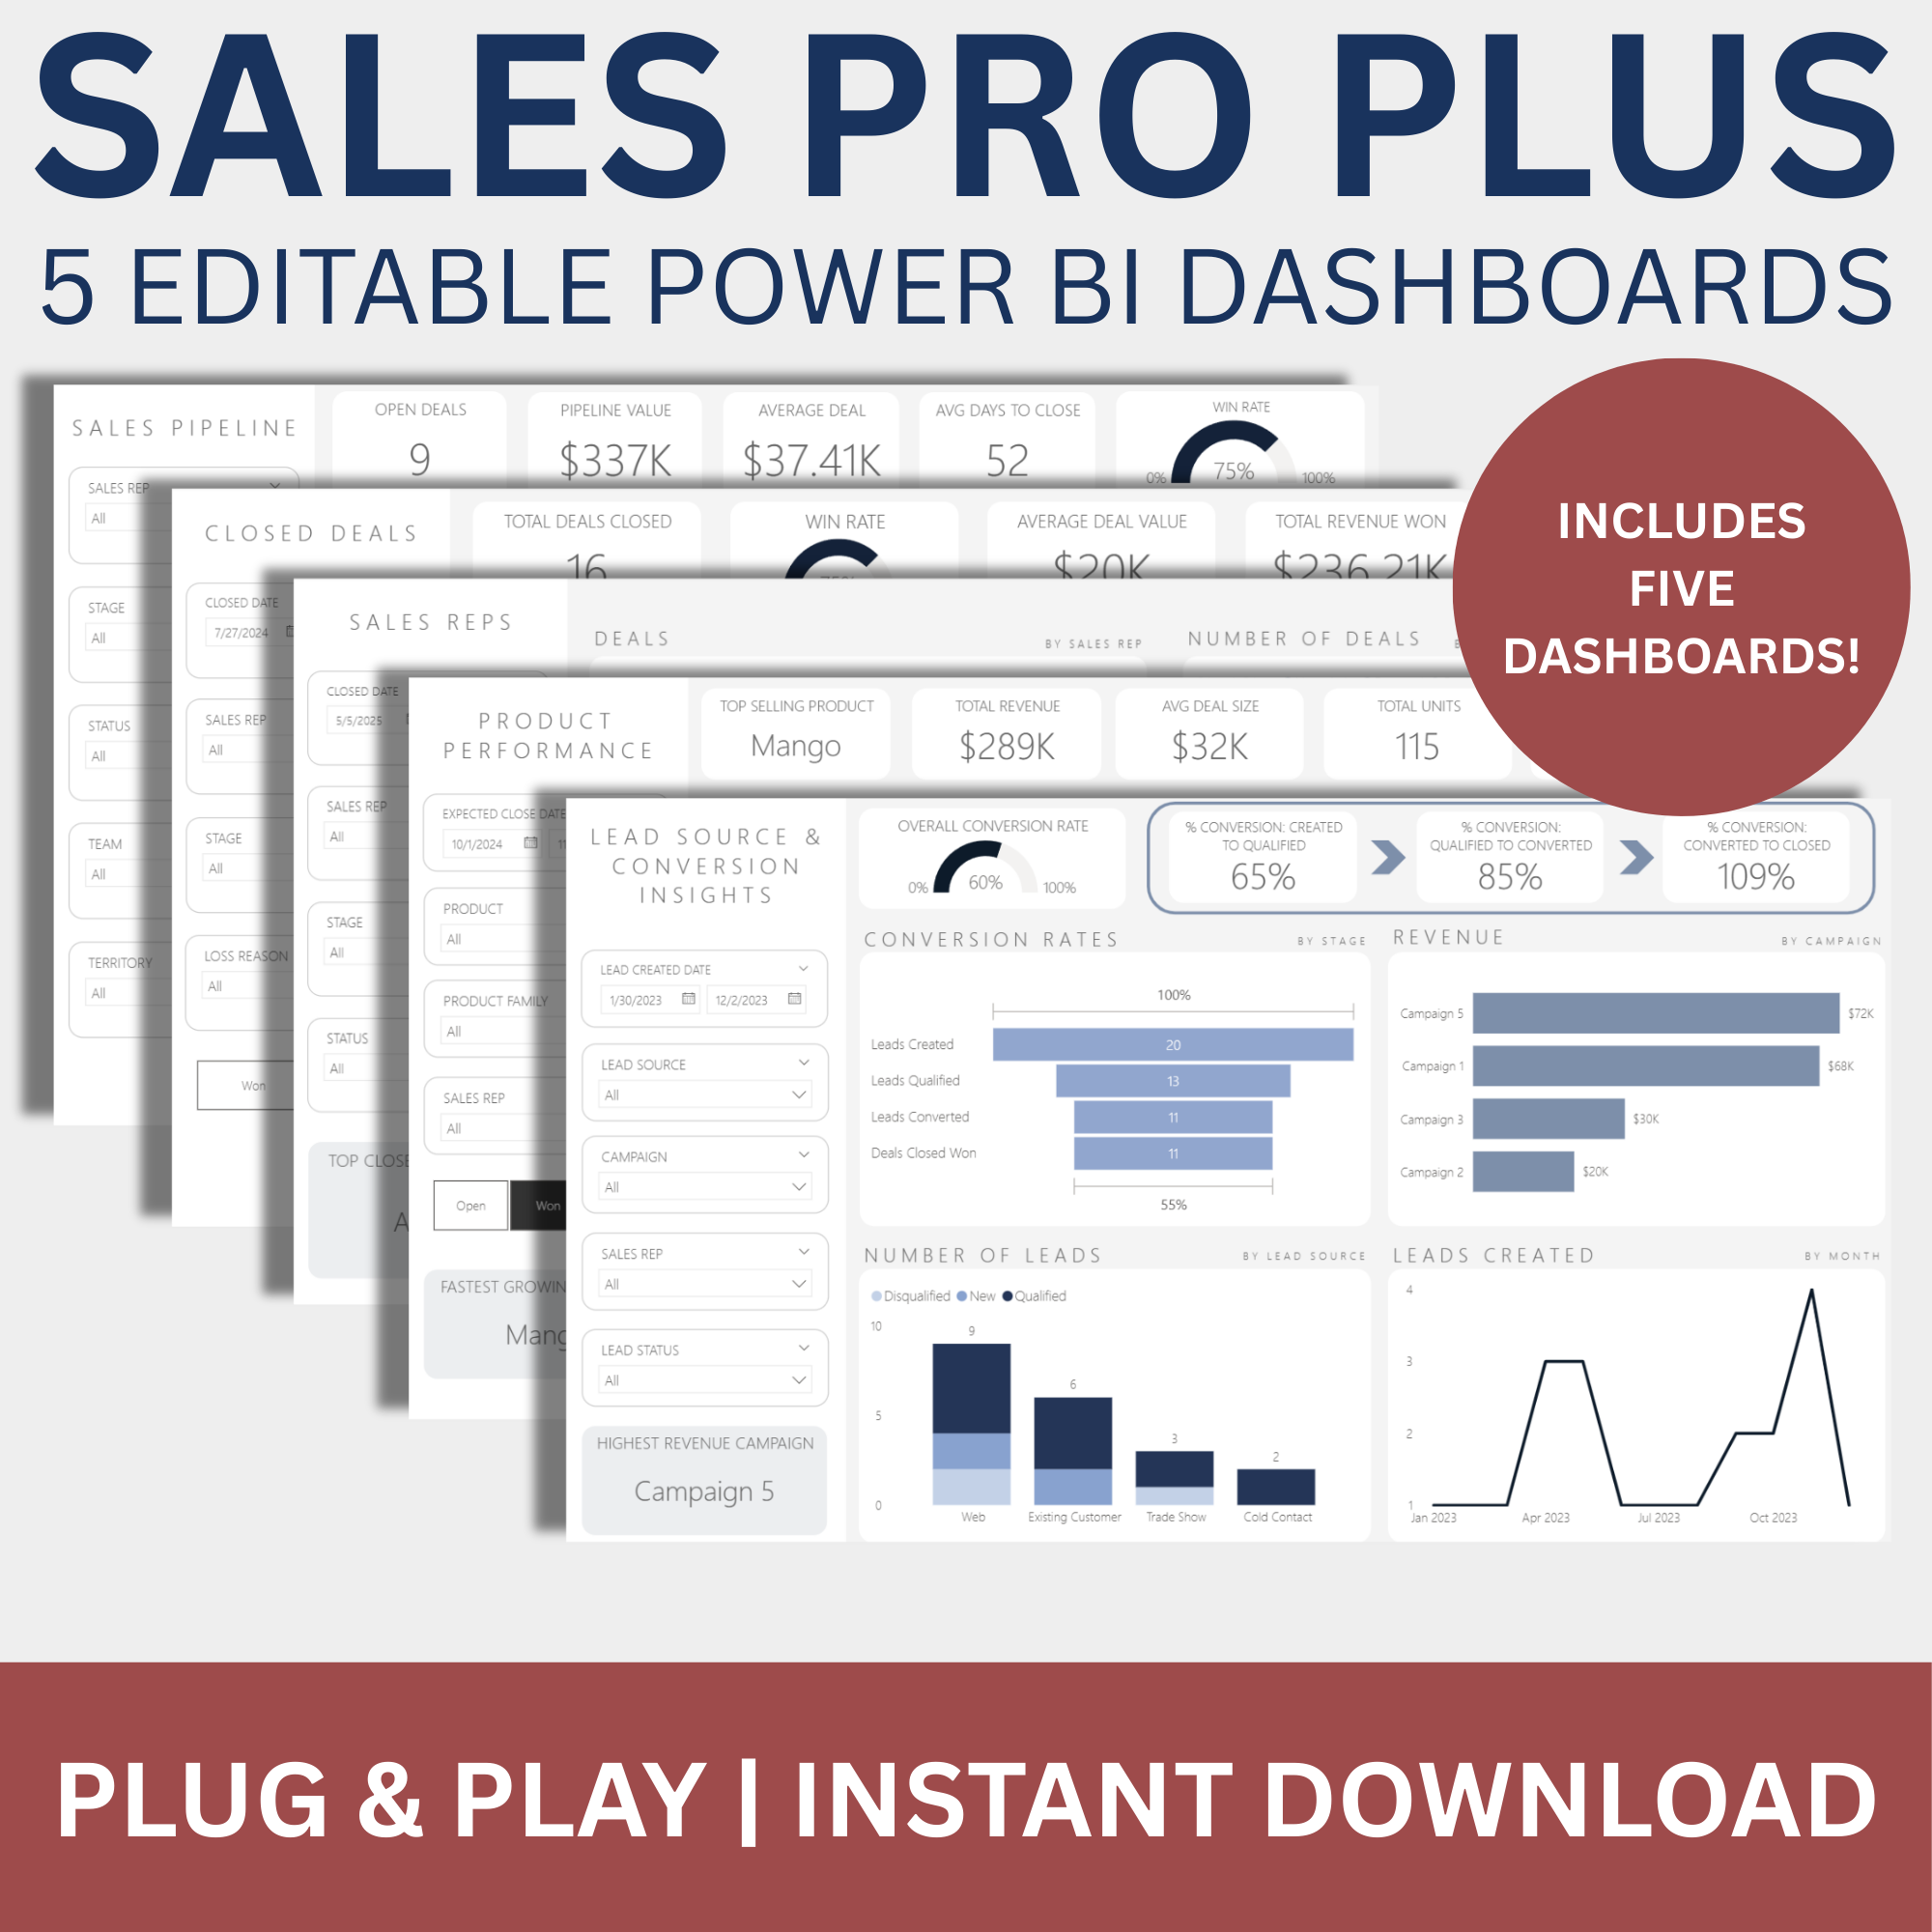
What You Get:
Includes filters for Product, Product Family, Sales Rep, and Expected Close Date to help you customize your view and compare performance across time periods, teams, or product categories.
Ideal for revenue leaders, product managers, and sales strategists who want a data-backed view of what’s actually selling—and why.
Discover which products are driving revenue—and which need attention—with the Product Performance Dashboard in the Sales Starter Kit. This dashboard delivers a clear, data-driven view of product-level sales performance, helping you analyze total revenue, deal size, discounting, and monthly trends by product or product family.
Whether you're in sales, product management, or revenue operations, this dashboard gives you the insight you need to make smarter decisions about pricing, bundling, and go-to-market strategies.
Instant Digital Download — Your dashboard will be delivered to your email immediately after checkout. No waiting, no shipping.
Key questions this dashboard answers:
What is our top-selling product by revenue or quantity?
Which products have the highest average deal size?
What’s the average discount by product or category?
How does monthly revenue trend across product families?
Which products are growing fastest over time?
Actionable insights you’ll gain:
Identify revenue leaders and underperforming products
Track discounting trends to protect margin
Adjust pricing and bundling based on sales behavior
Spot seasonality or momentum in specific product lines
Drive cross-functional decisions across sales and product teams
What You Get:
Includes filters for Product, Product Family, Sales Rep, and Expected Close Date to help you customize your view and compare performance across time periods, teams, or product categories.
Ideal for revenue leaders, product managers, and sales strategists who want a data-backed view of what’s actually selling—and why.

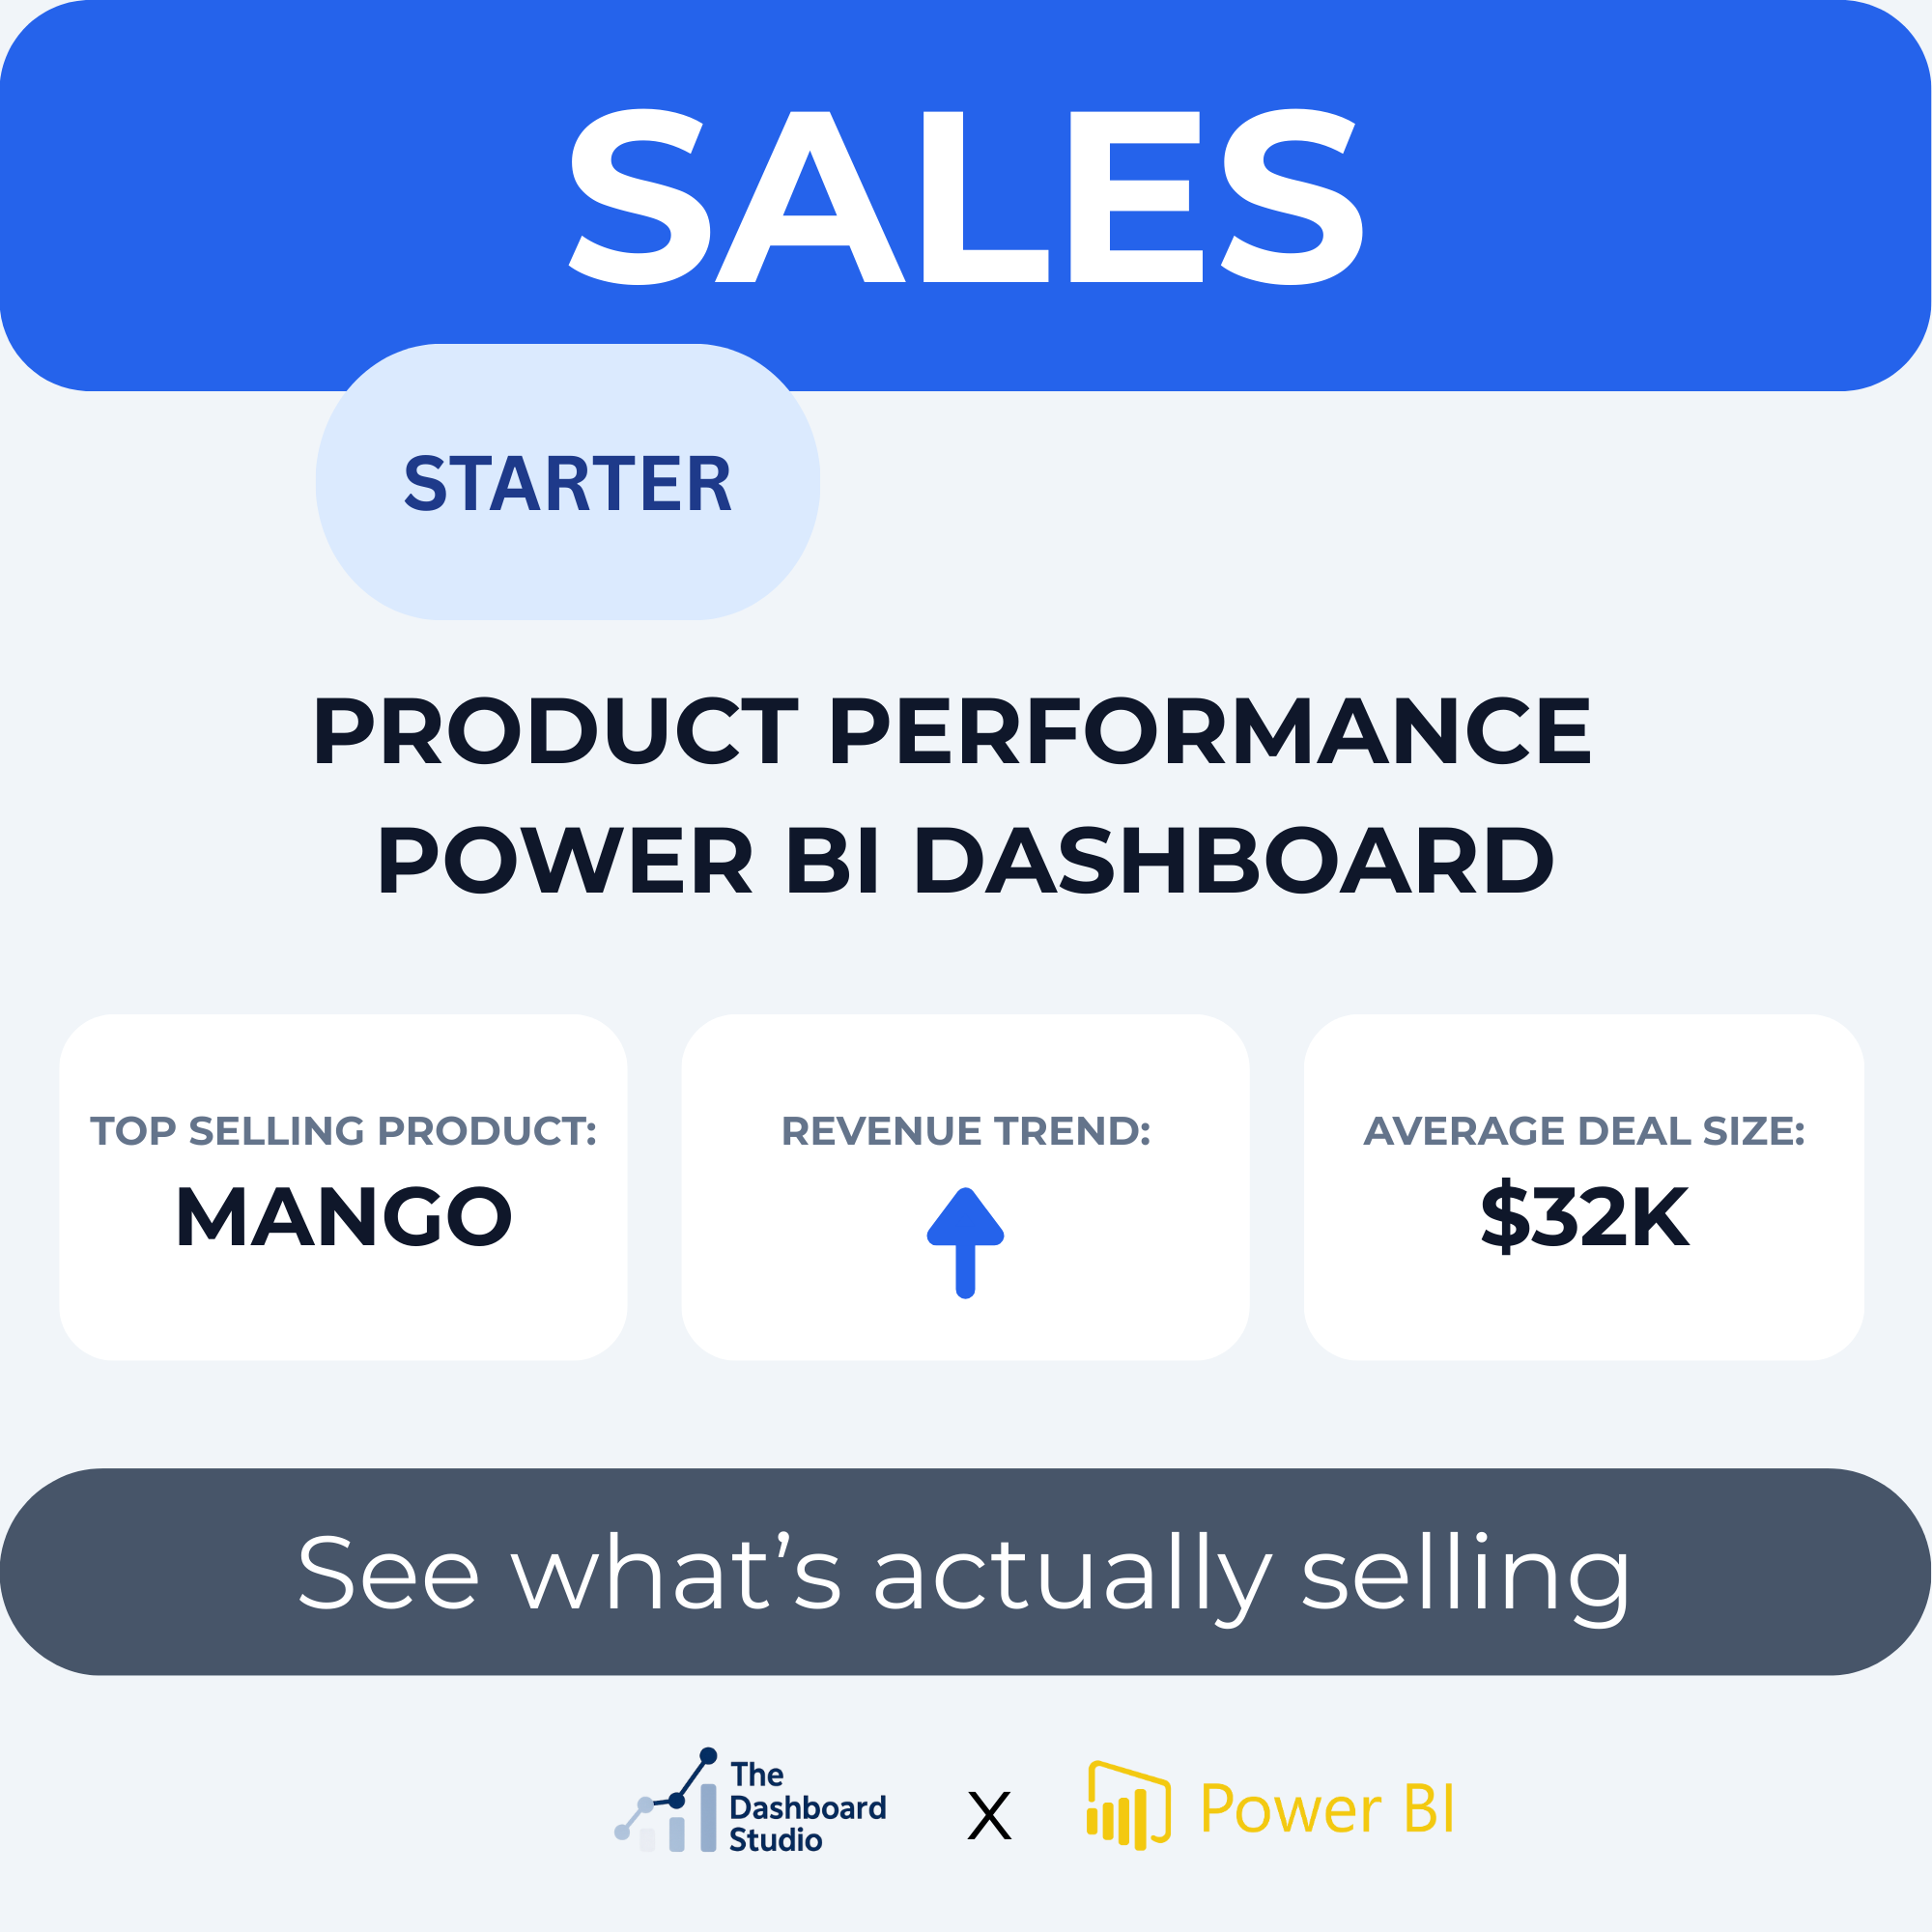 Image 1 of 5
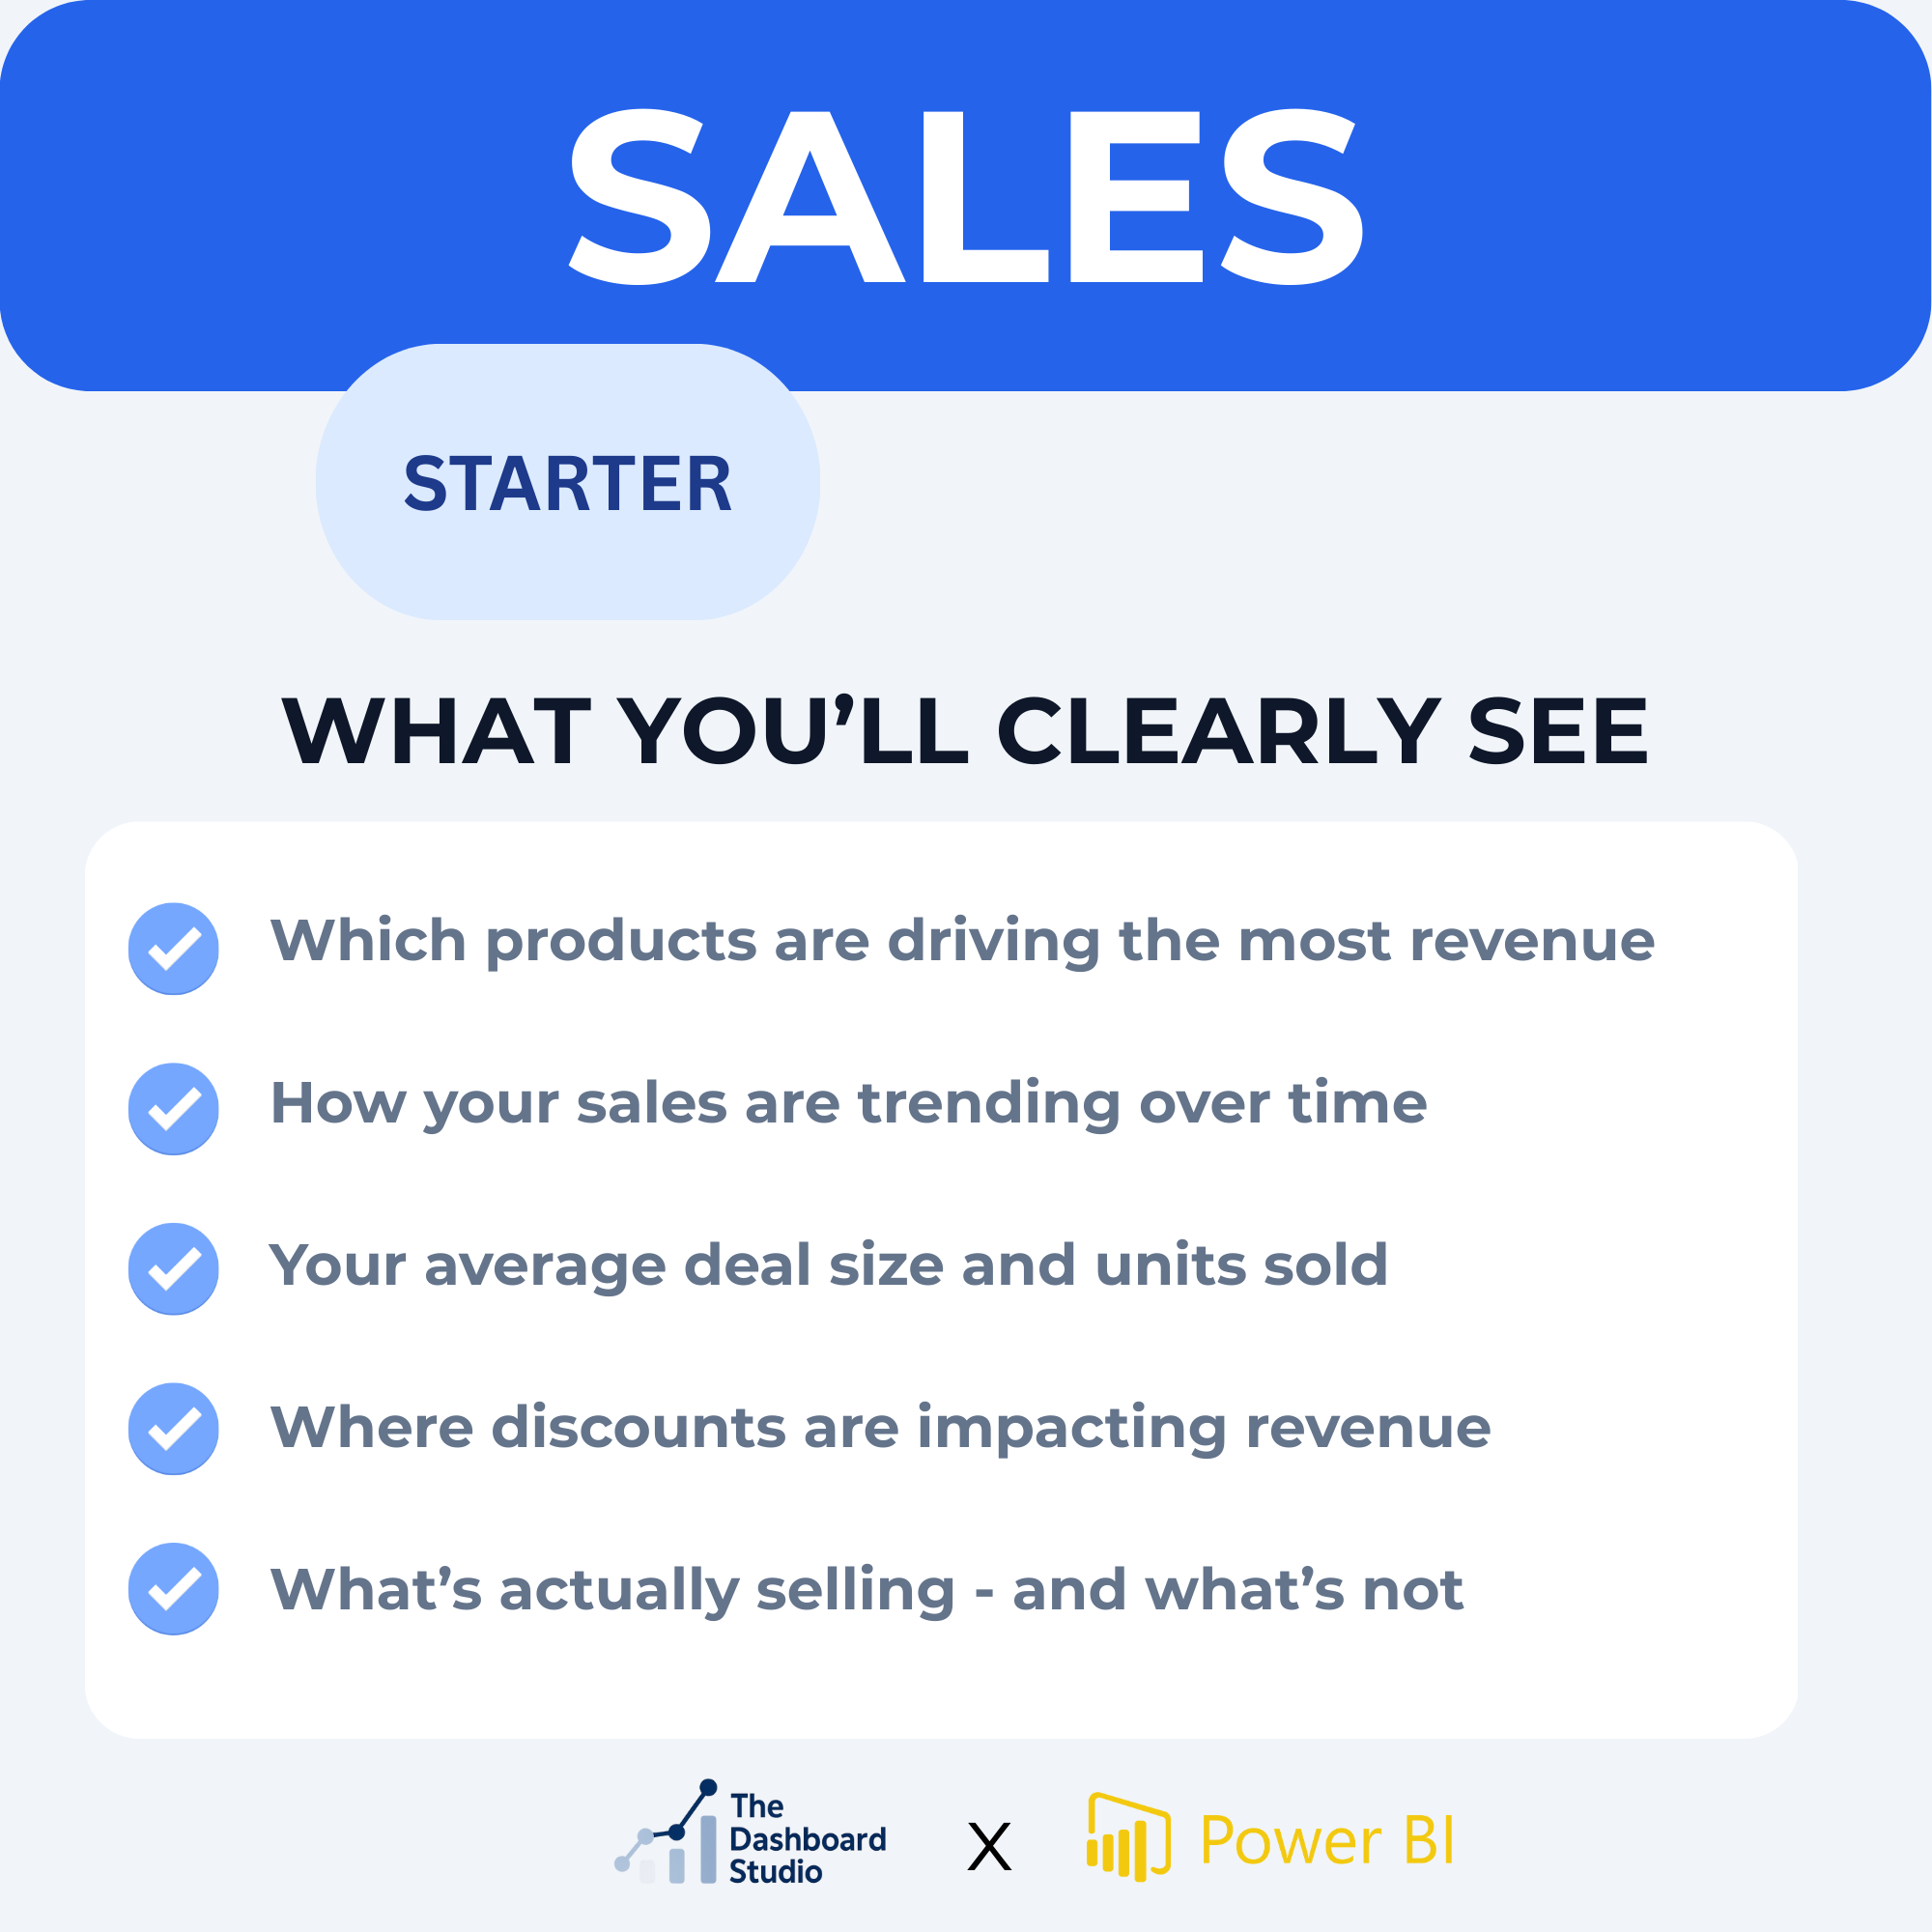 Image 2 of 5
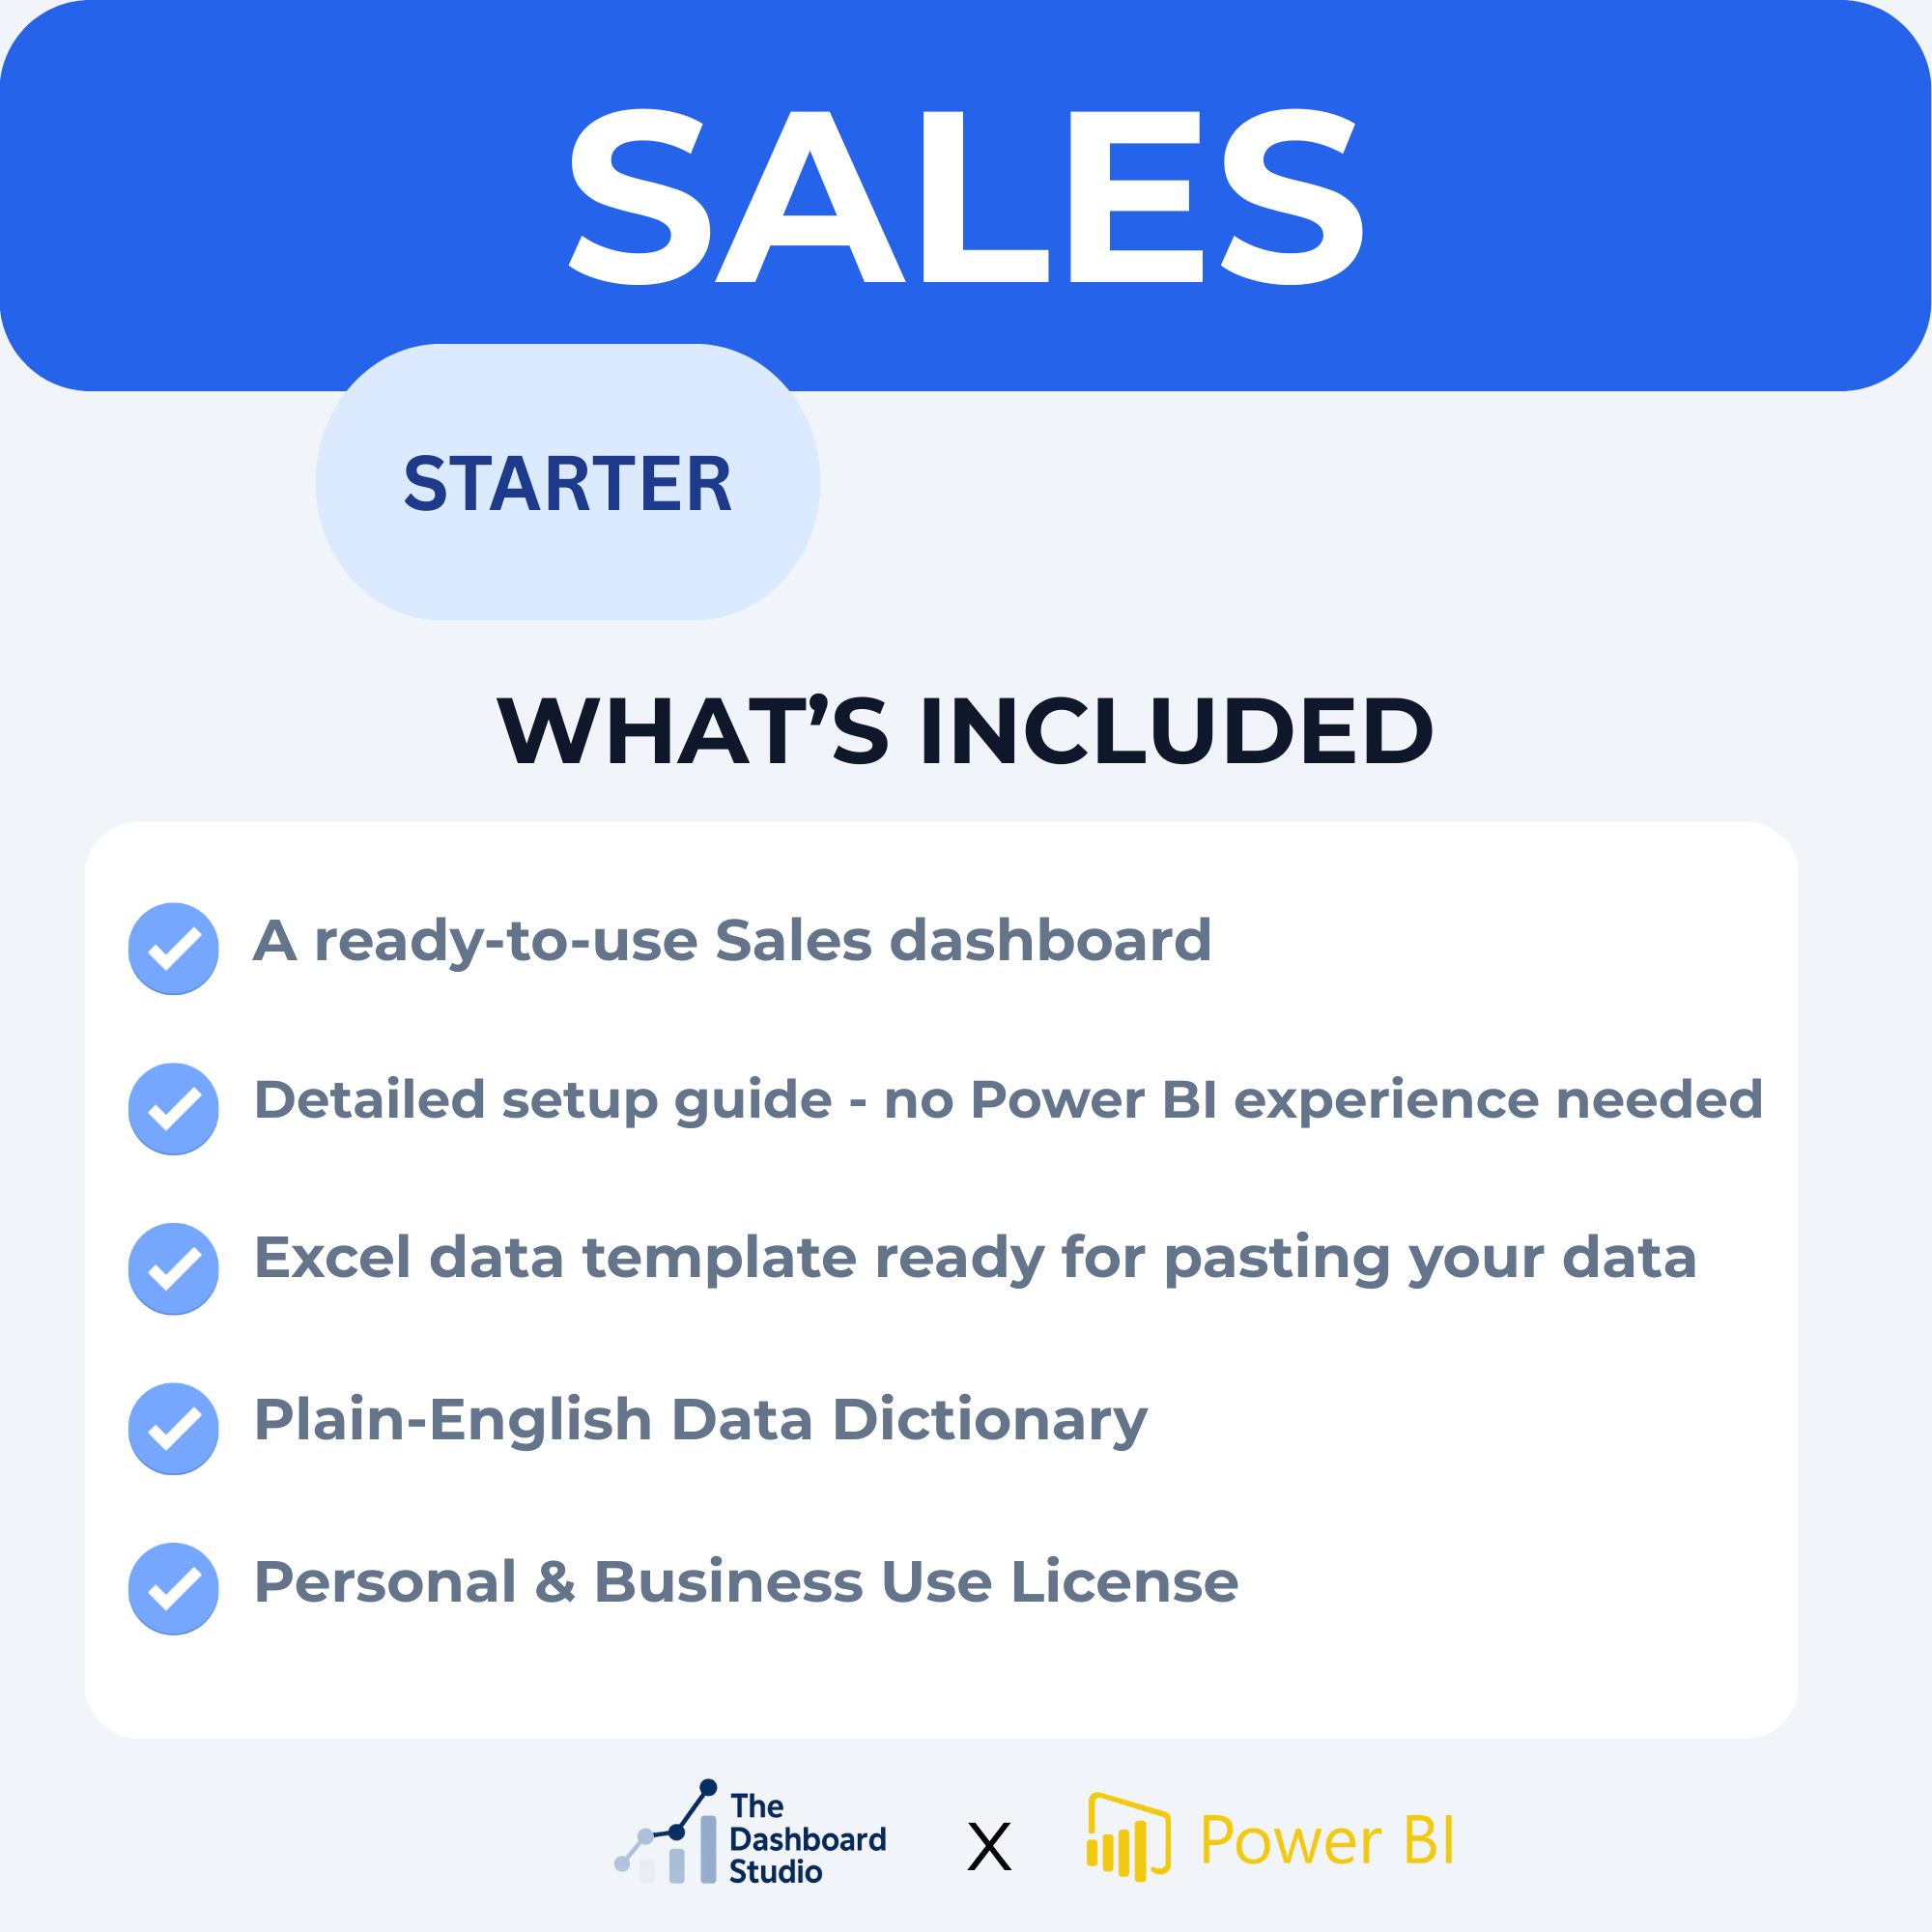 Image 3 of 5
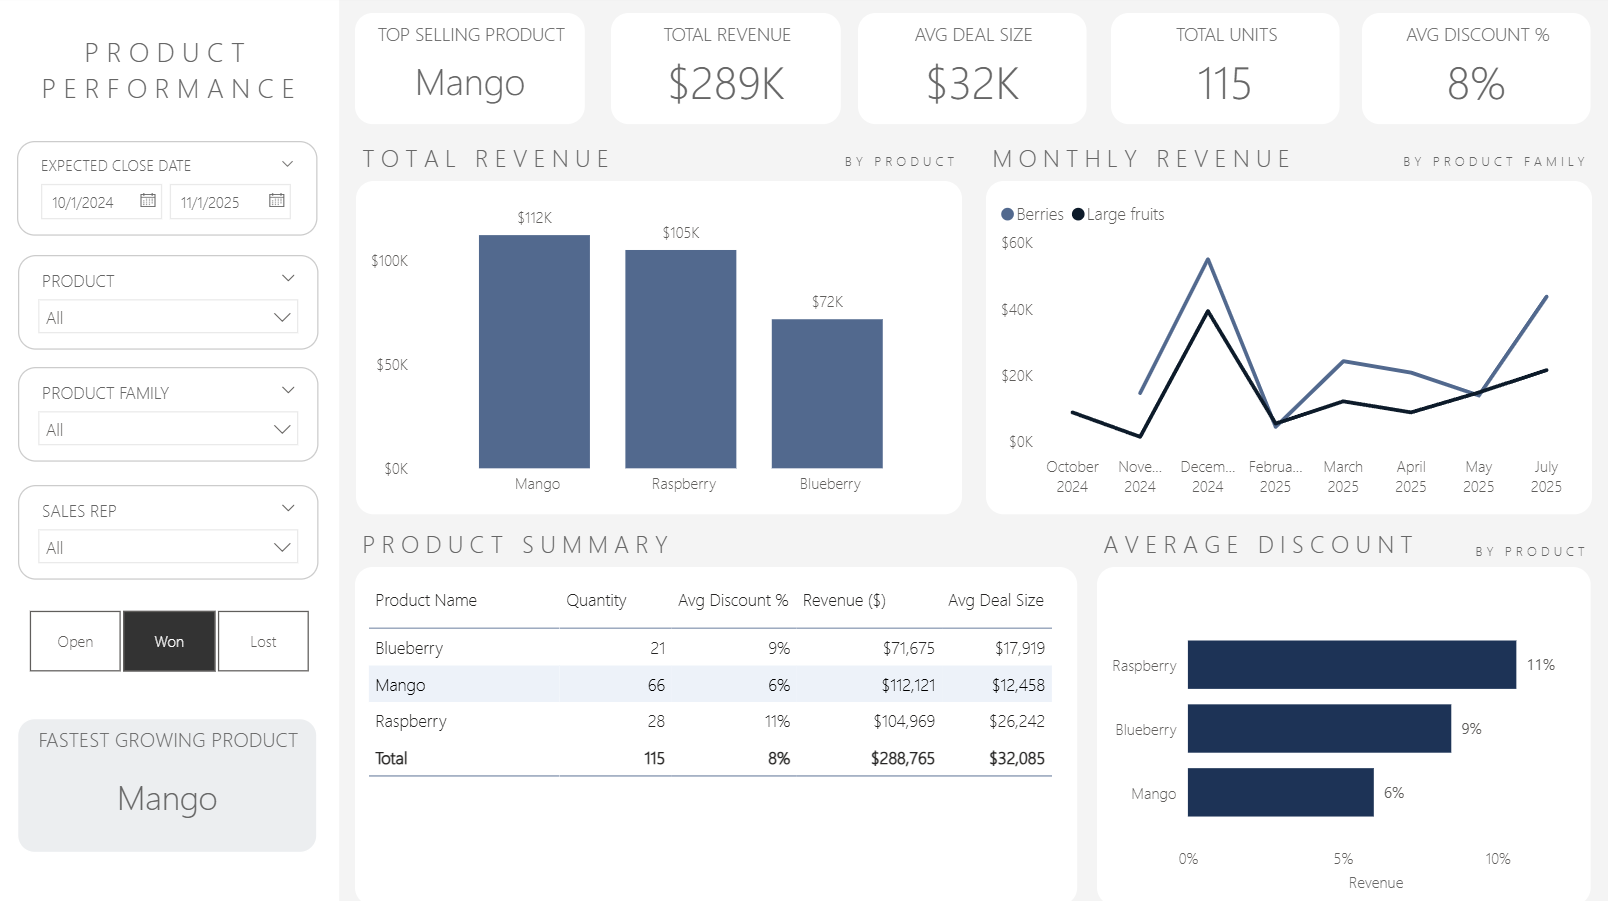 Image 4 of 5
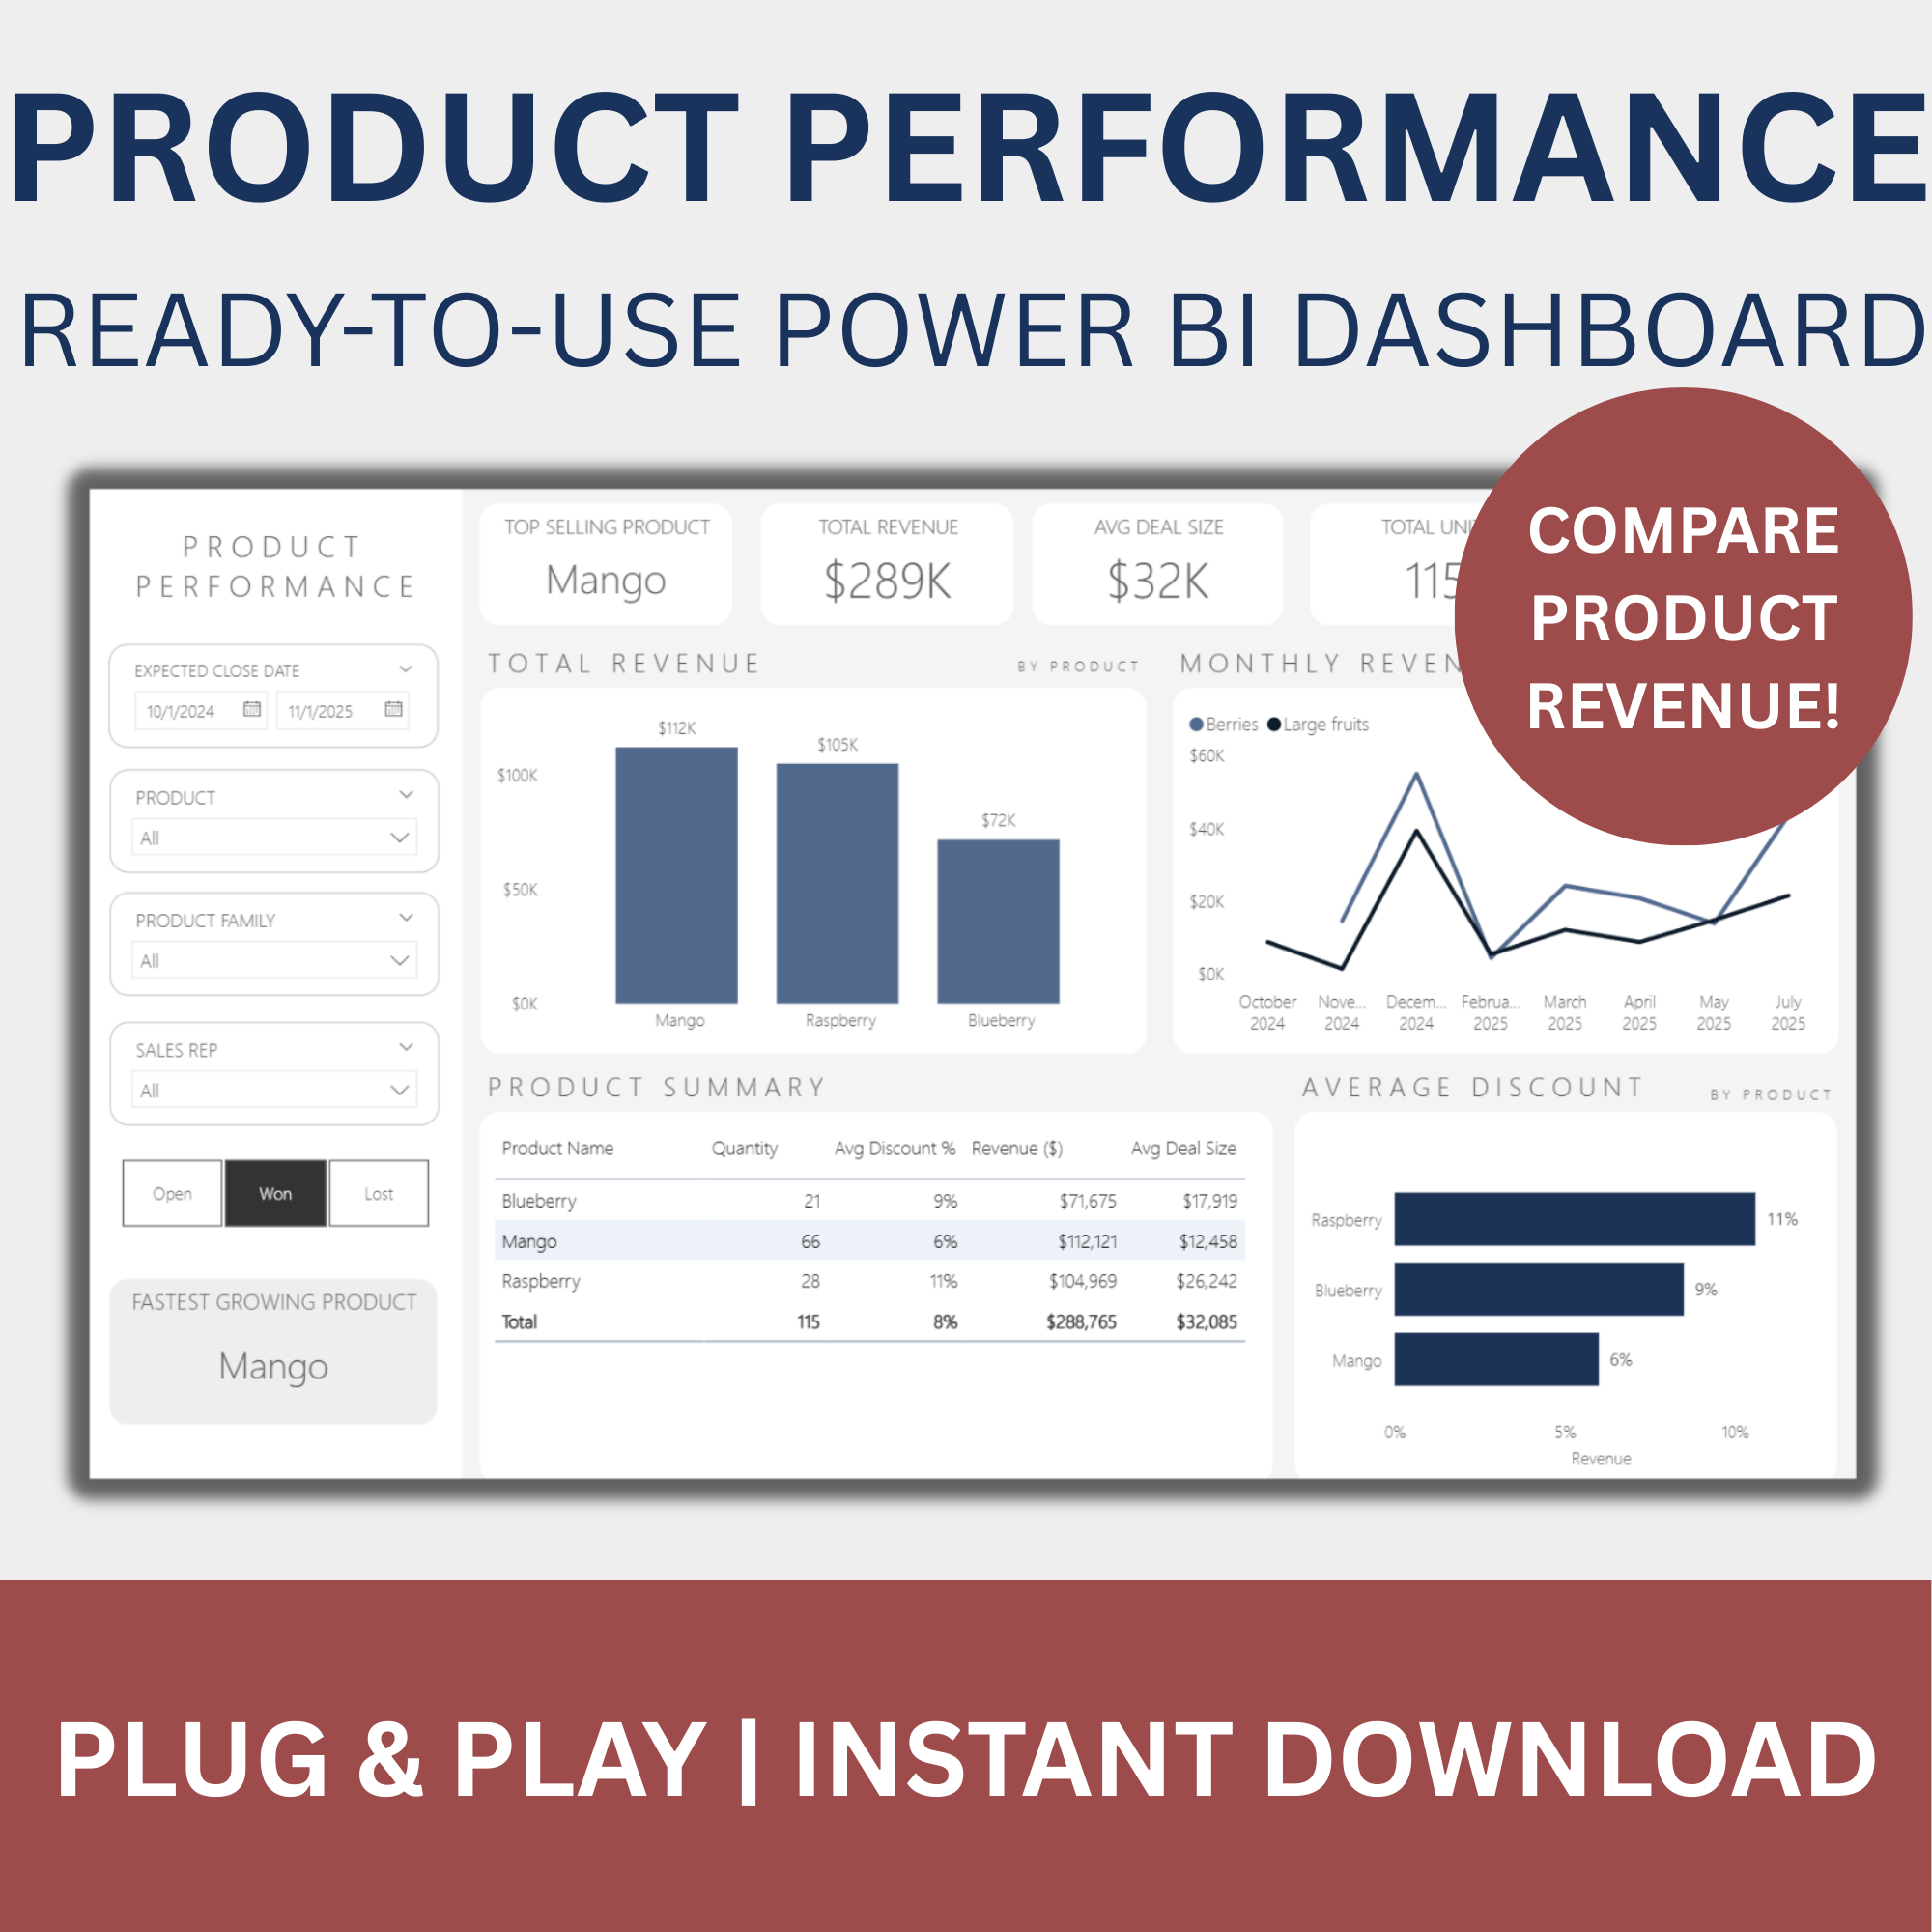 Image 5 of 5