 Image 1 of 2
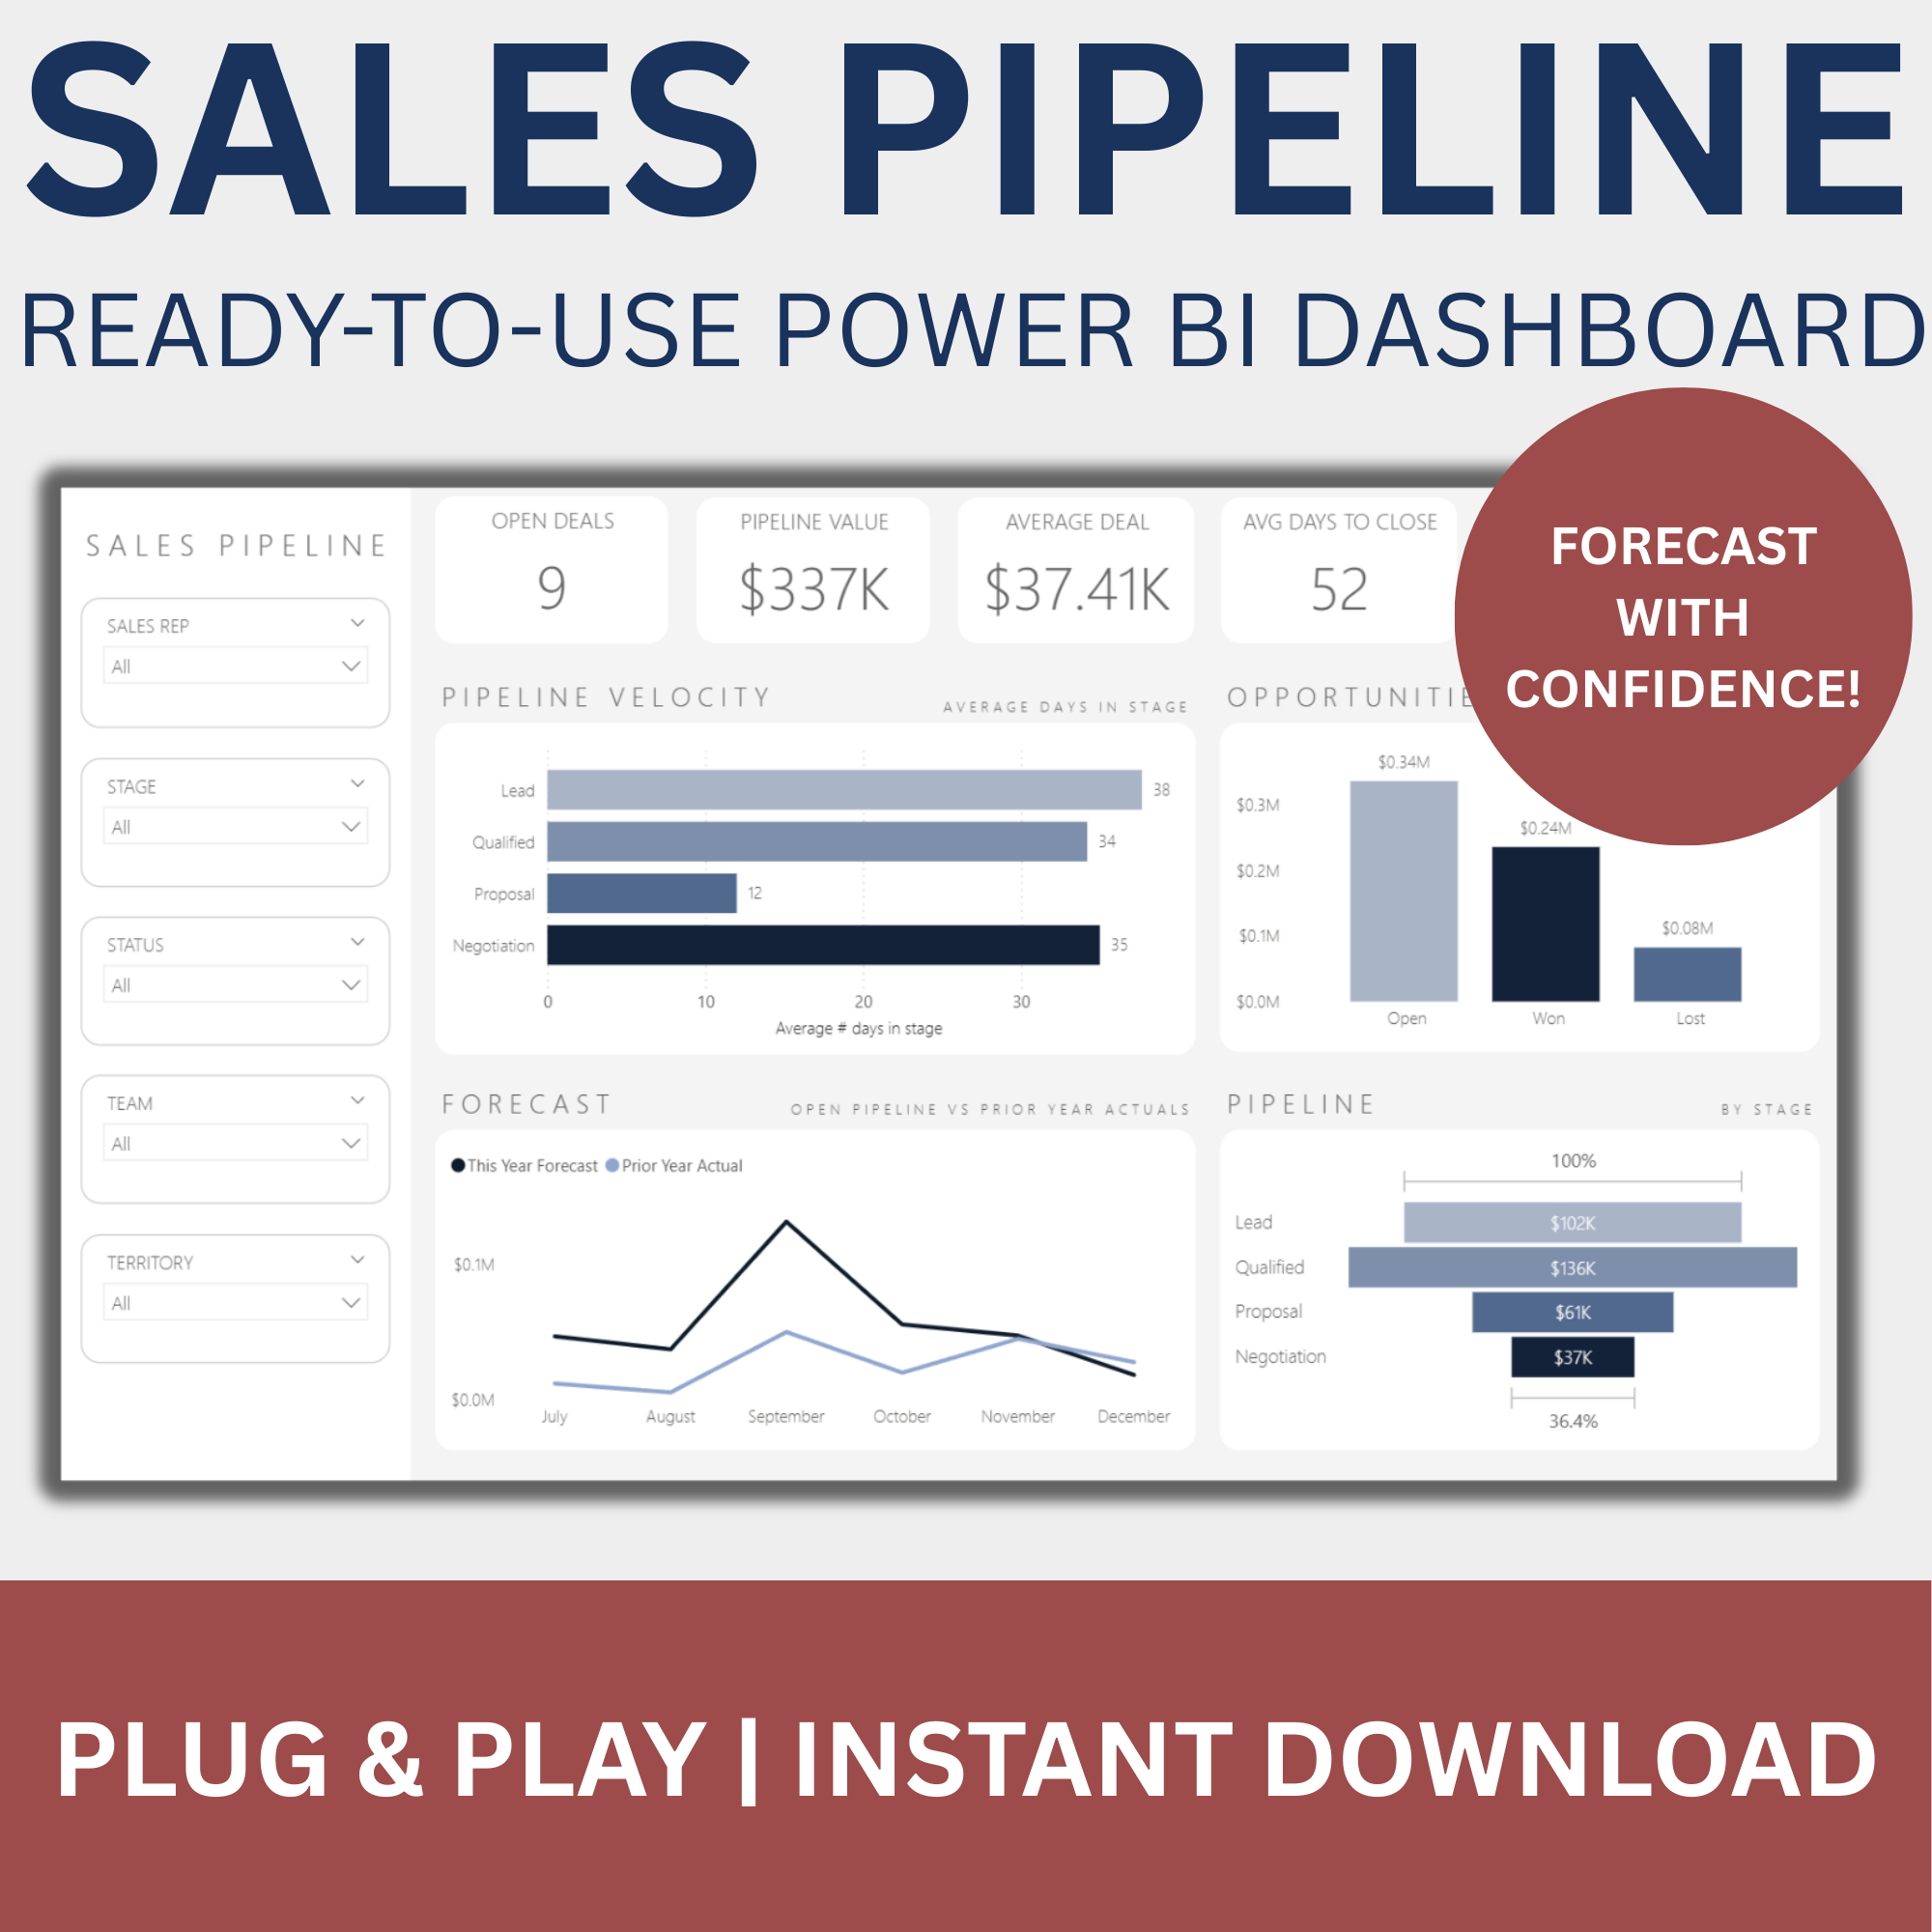 Image 2 of 2
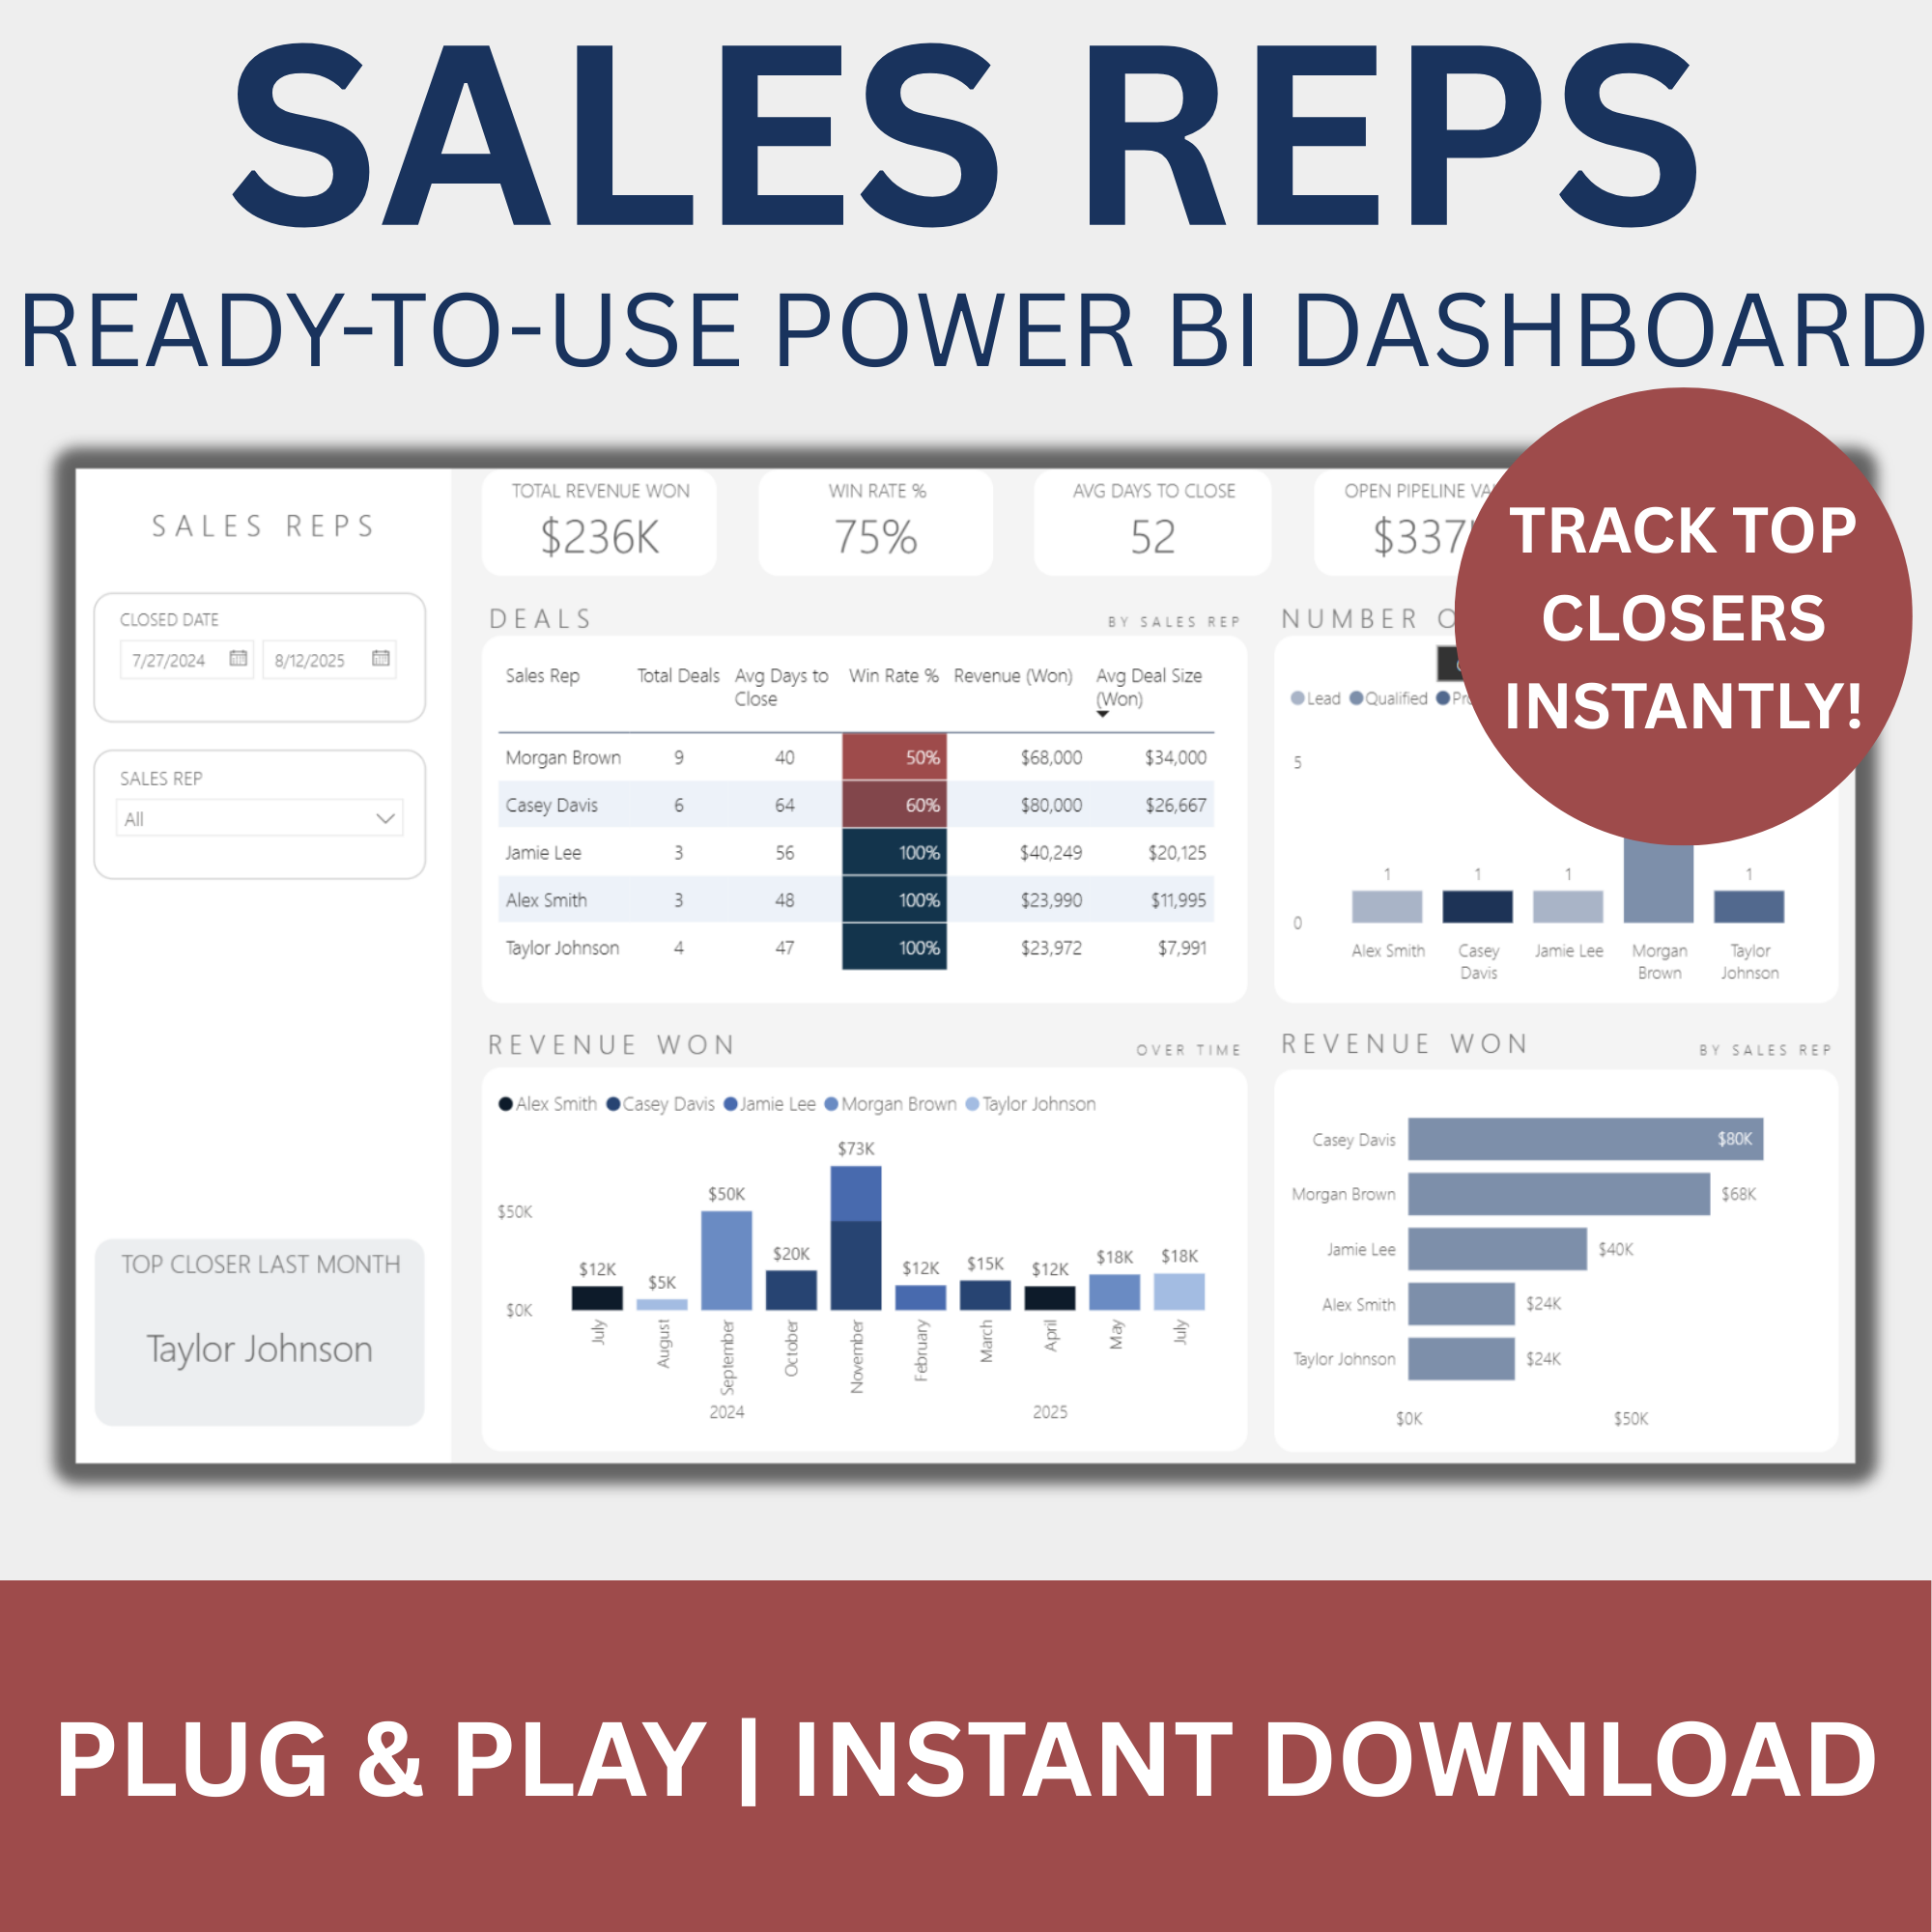
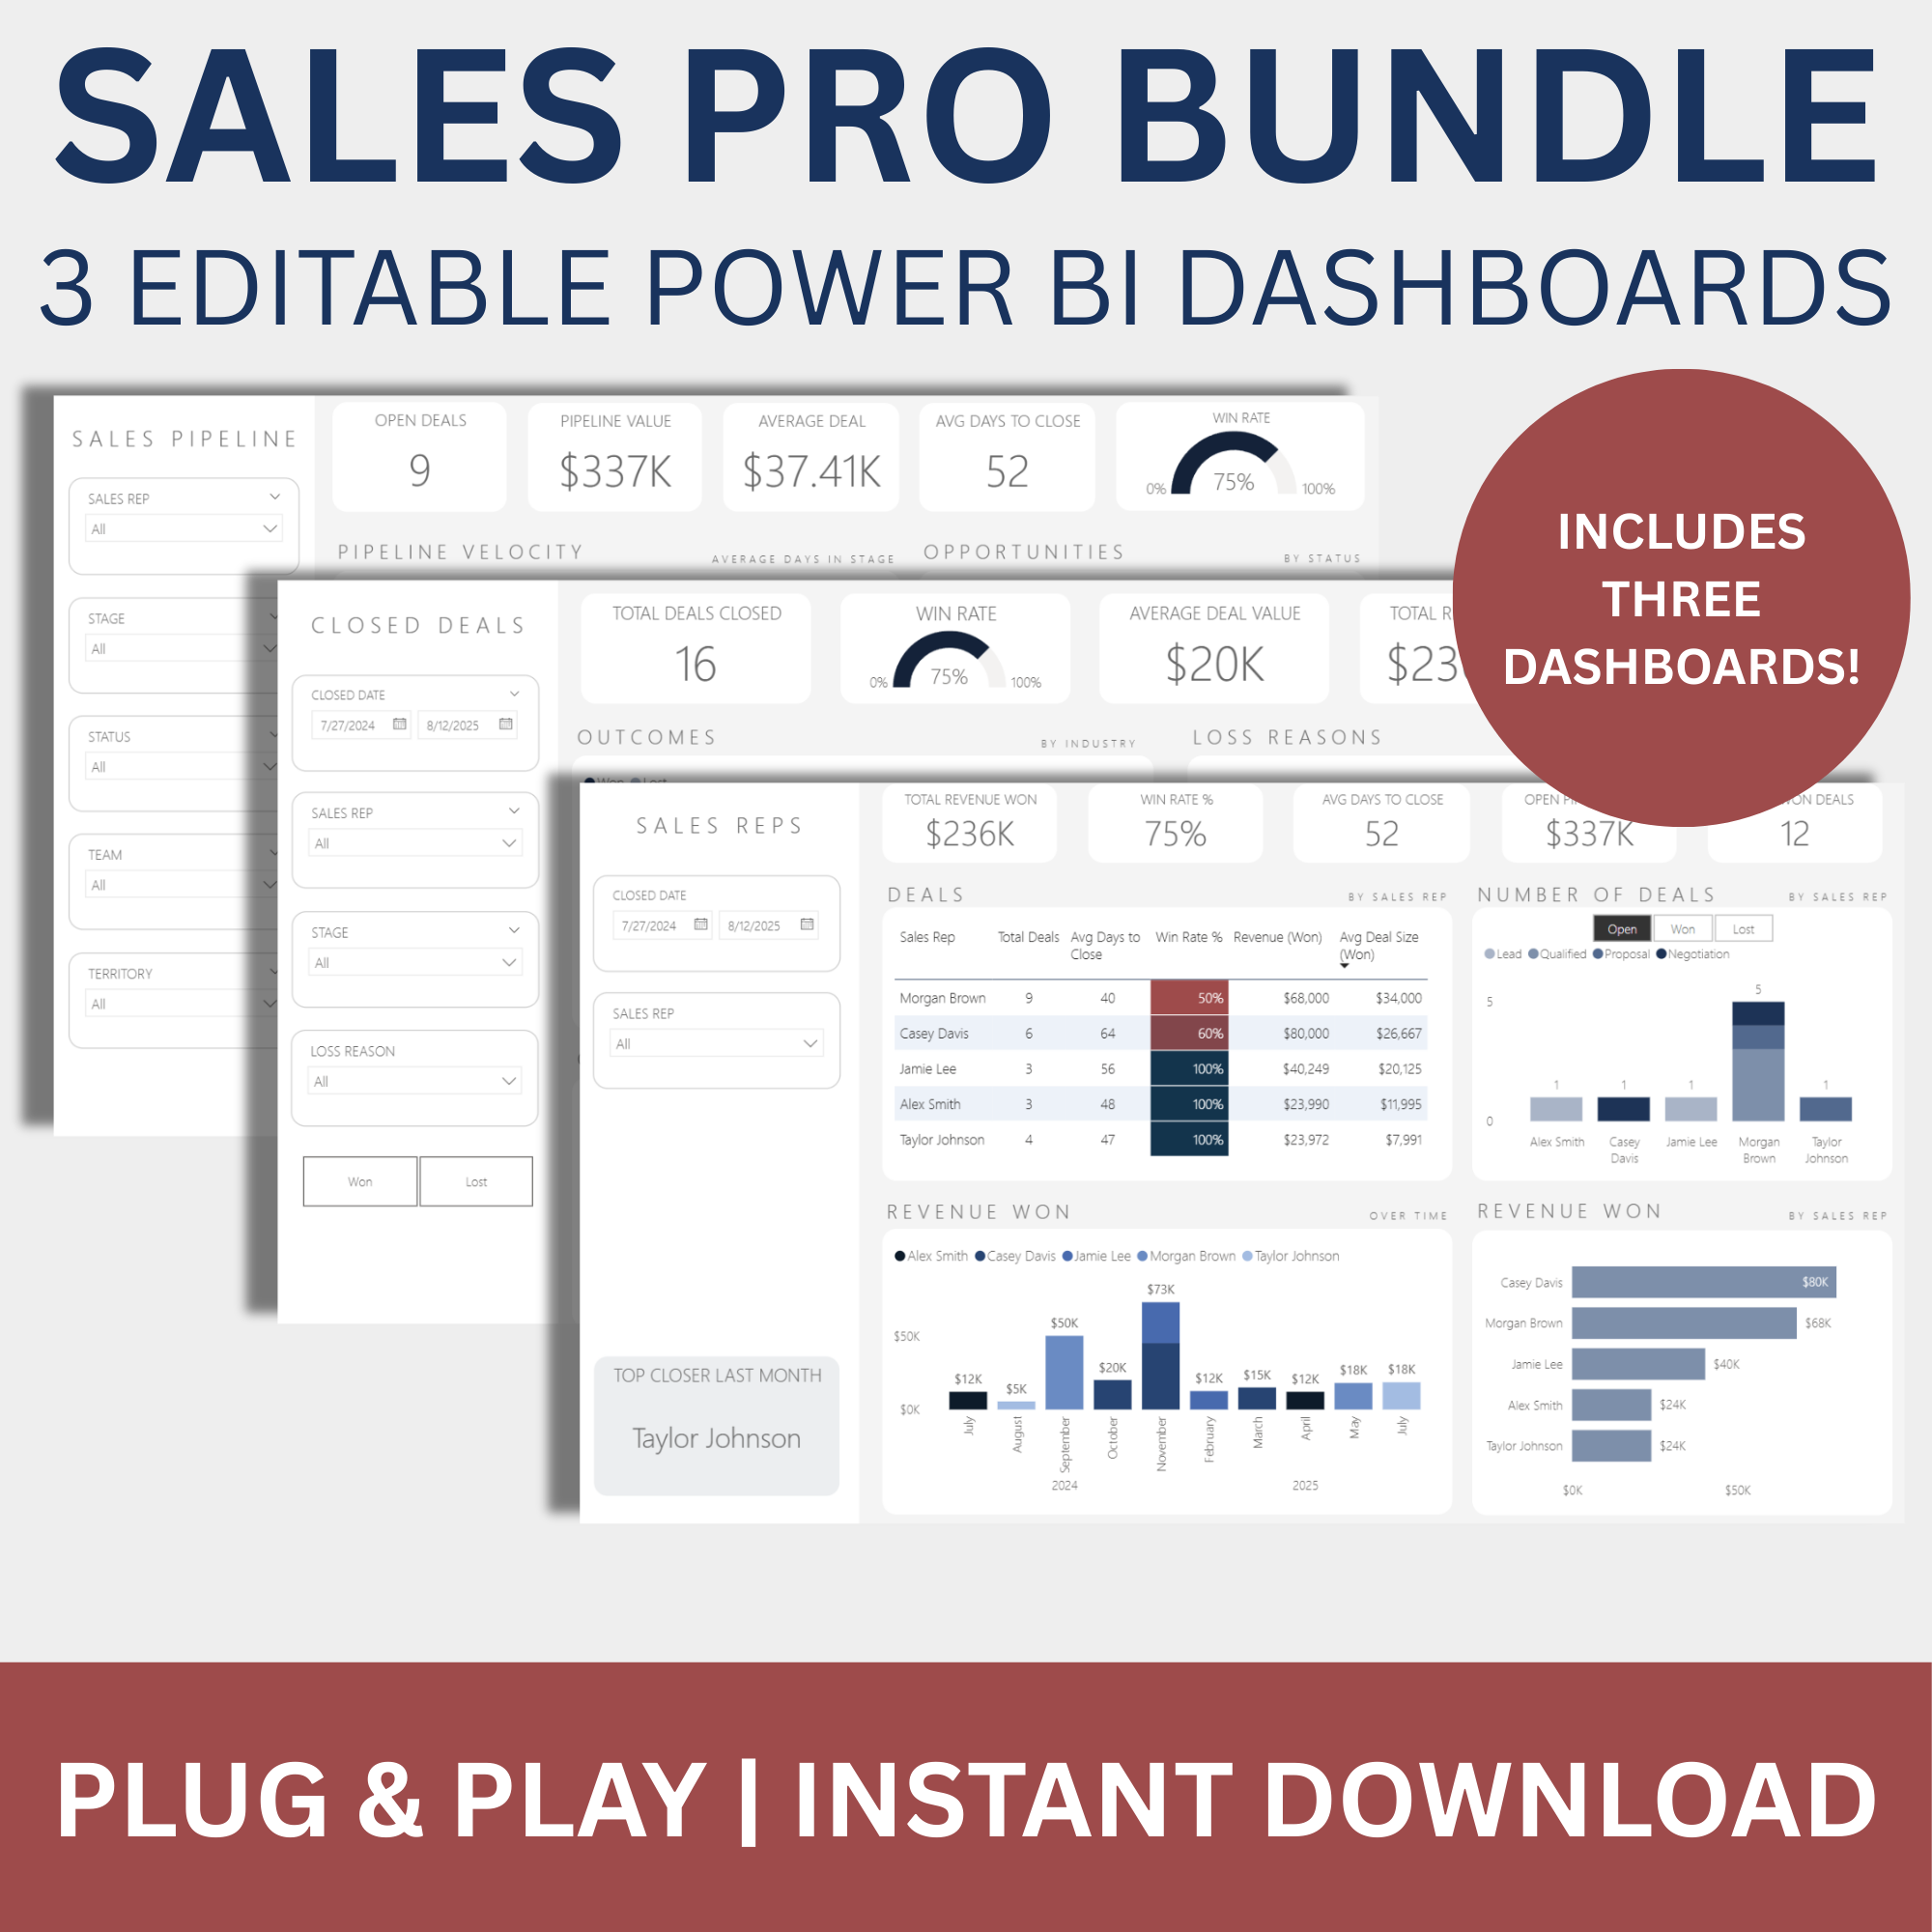
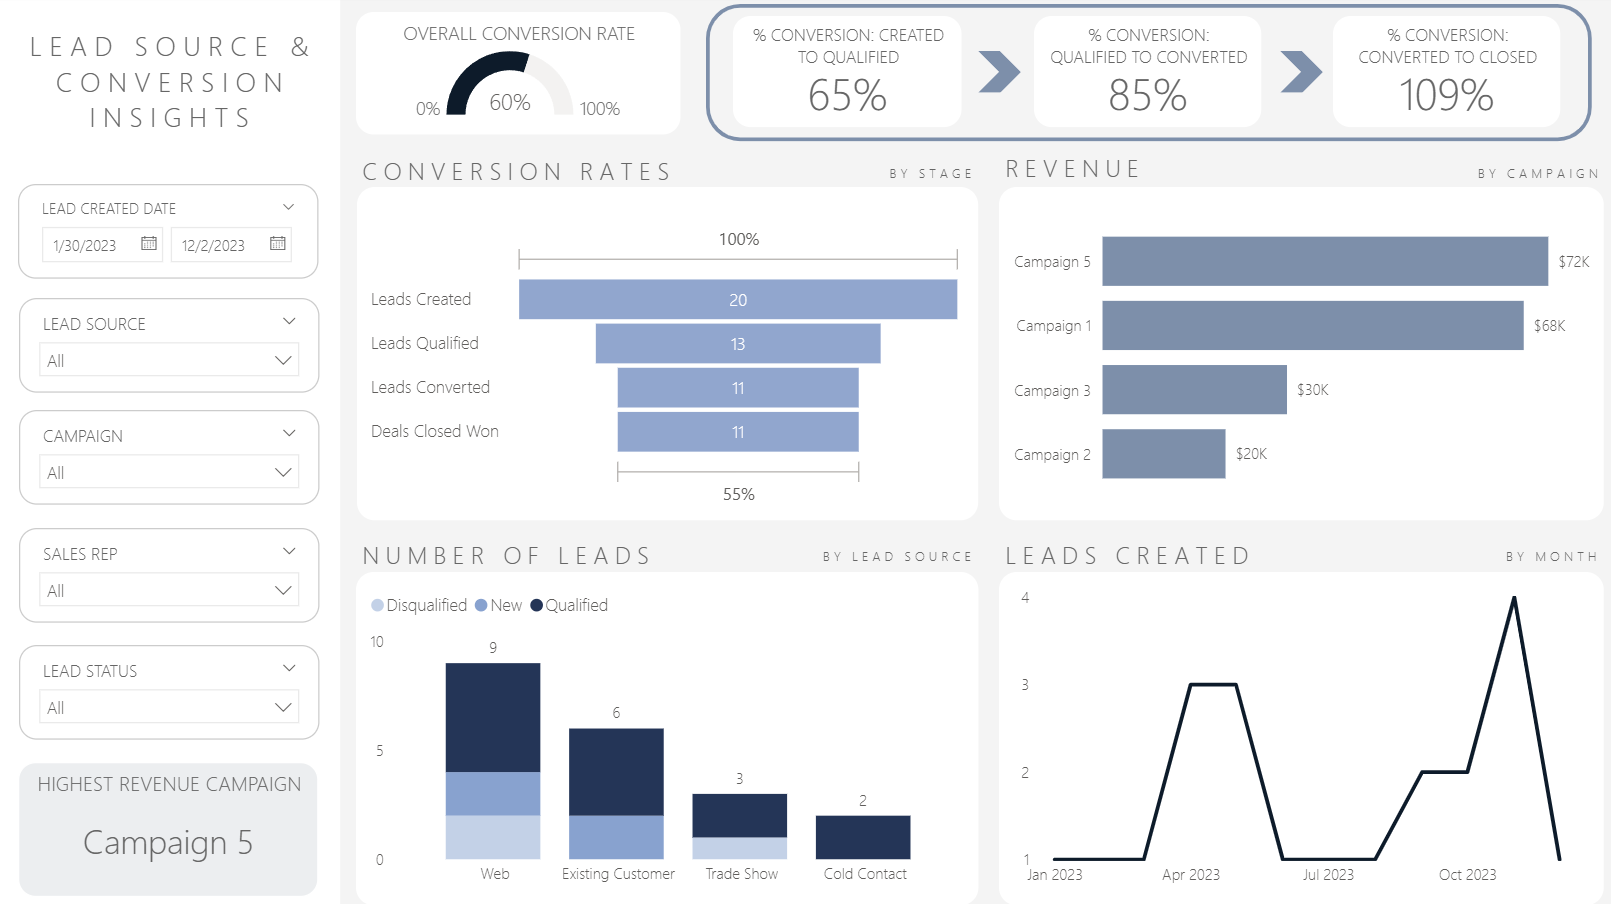
Gain complete visibility into your active sales funnel with the Sales Pipeline Dashboard. This dynamic, interactive dashboard tracks every stage of the sales process—from lead to close—helping you forecast revenue, monitor deal velocity, and optimize your pipeline for better results.
Whether you're managing a team or reviewing your own deals, this dashboard provides a clear, data-driven snapshot of where each opportunity stands and what actions are needed next.
Instant Digital Download — Your dashboard will be delivered to your email immediately after checkout. No waiting, no shipping.
Key questions this dashboard answers:
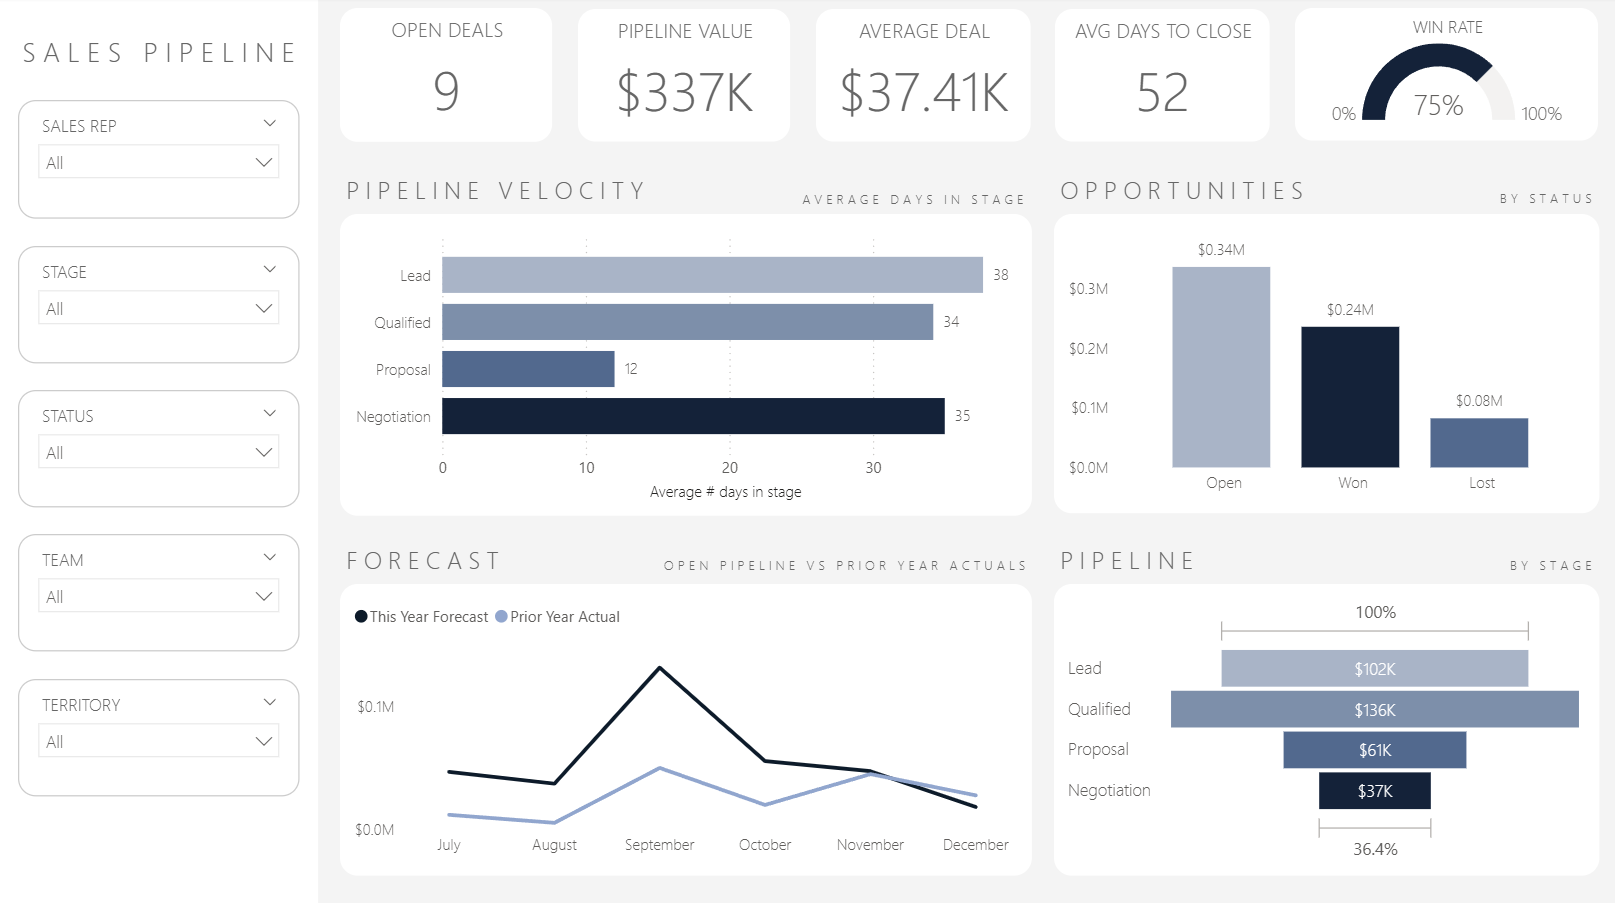
How many deals are currently in my pipeline, and at which stages?
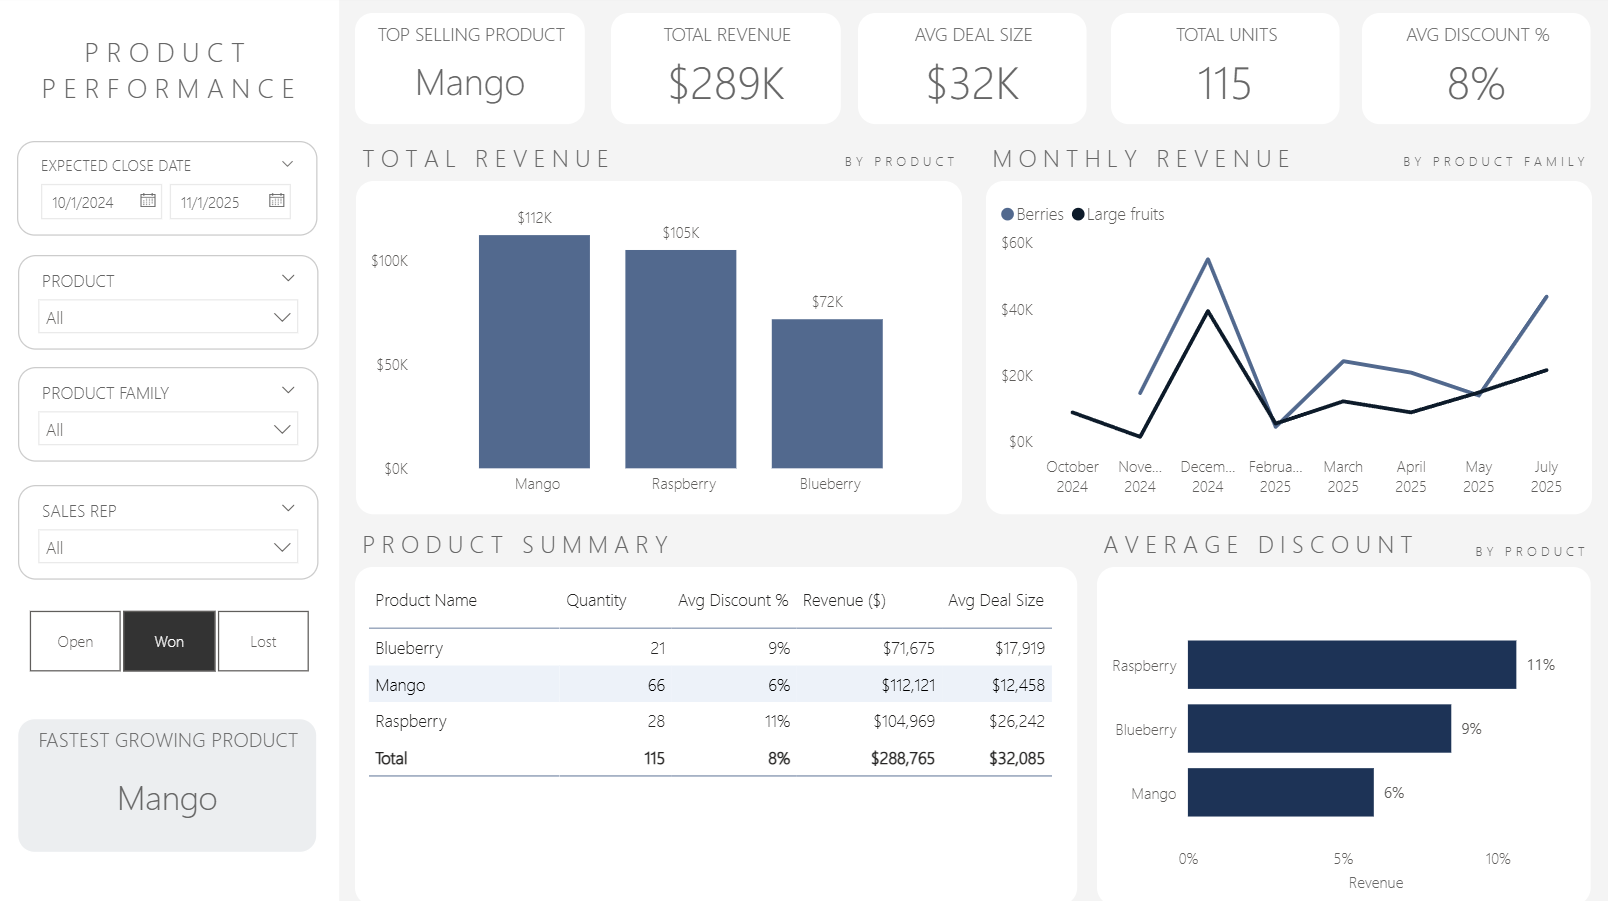
What is the total pipeline value and average deal size?
How long are deals staying in each stage?
What’s my win rate and average days to close?
How does this year’s forecast compare to last year’s performance?
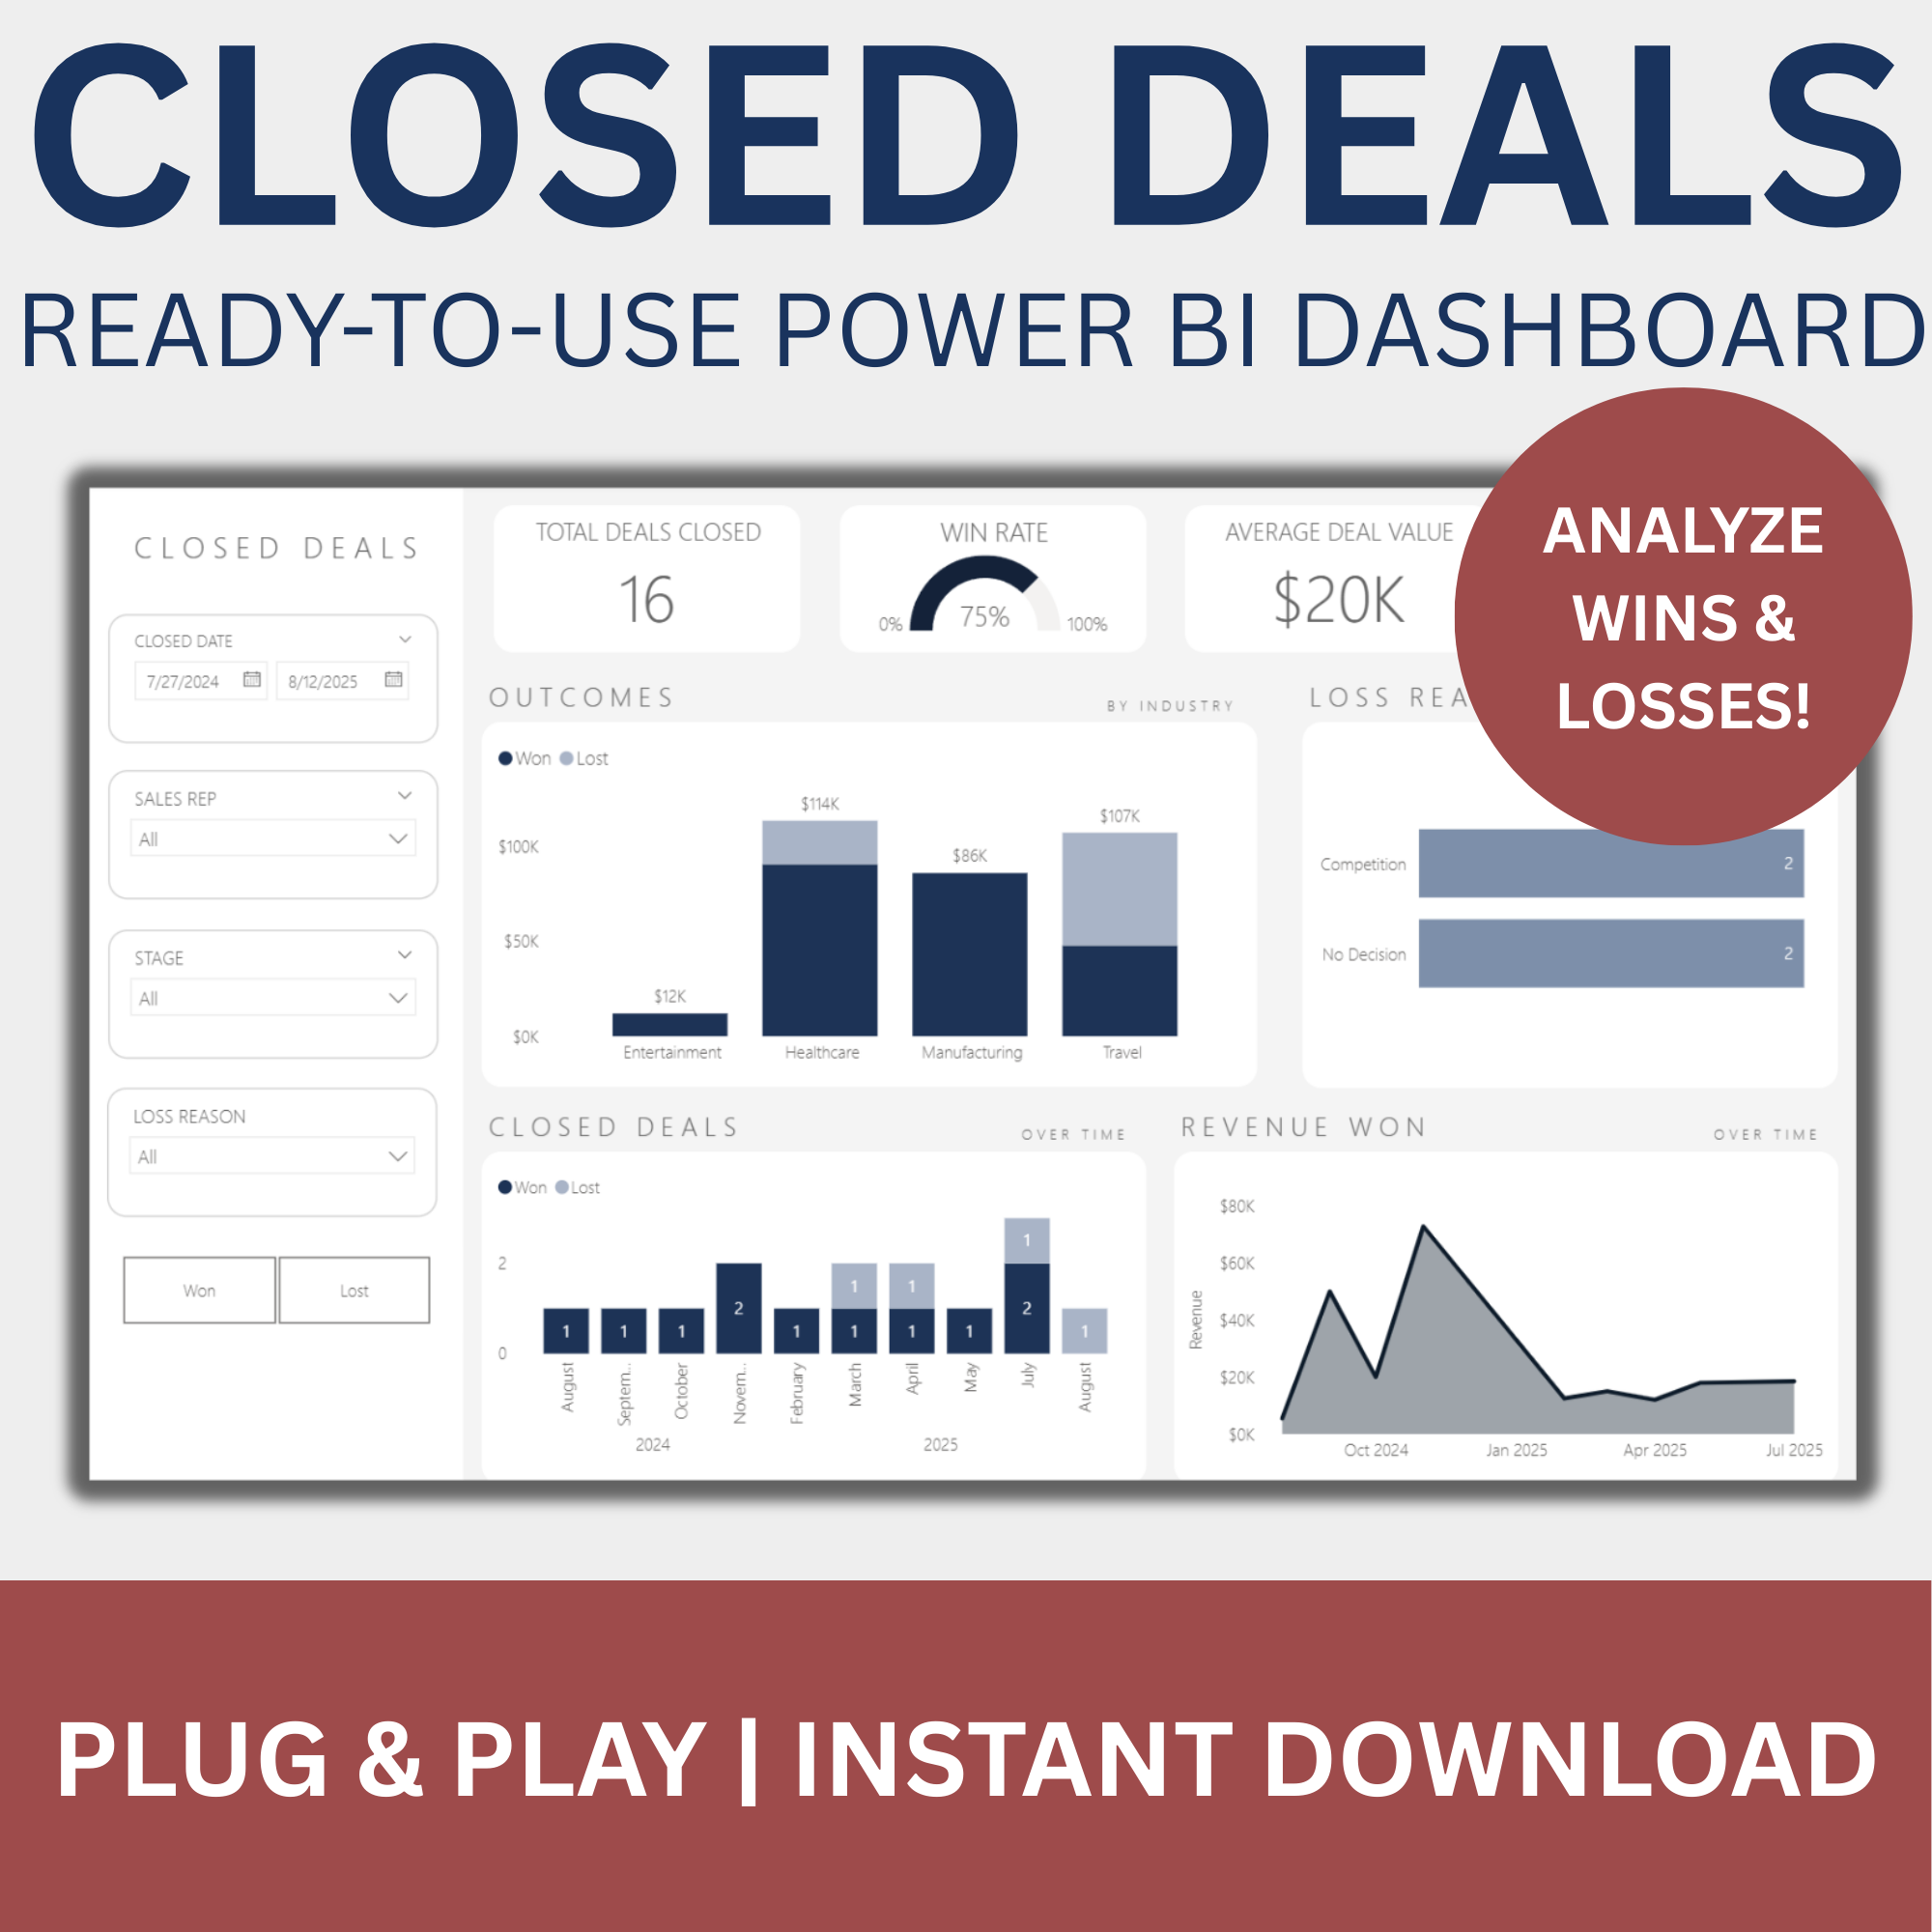
Actionable insights you’ll gain:
Identify bottlenecks where deals are stalling
Spot high-value opportunities at risk of delay
Track performance by sales stage to improve conversions
Compare current pipeline strength to historical benchmarks
Improve forecast accuracy with real-time metrics
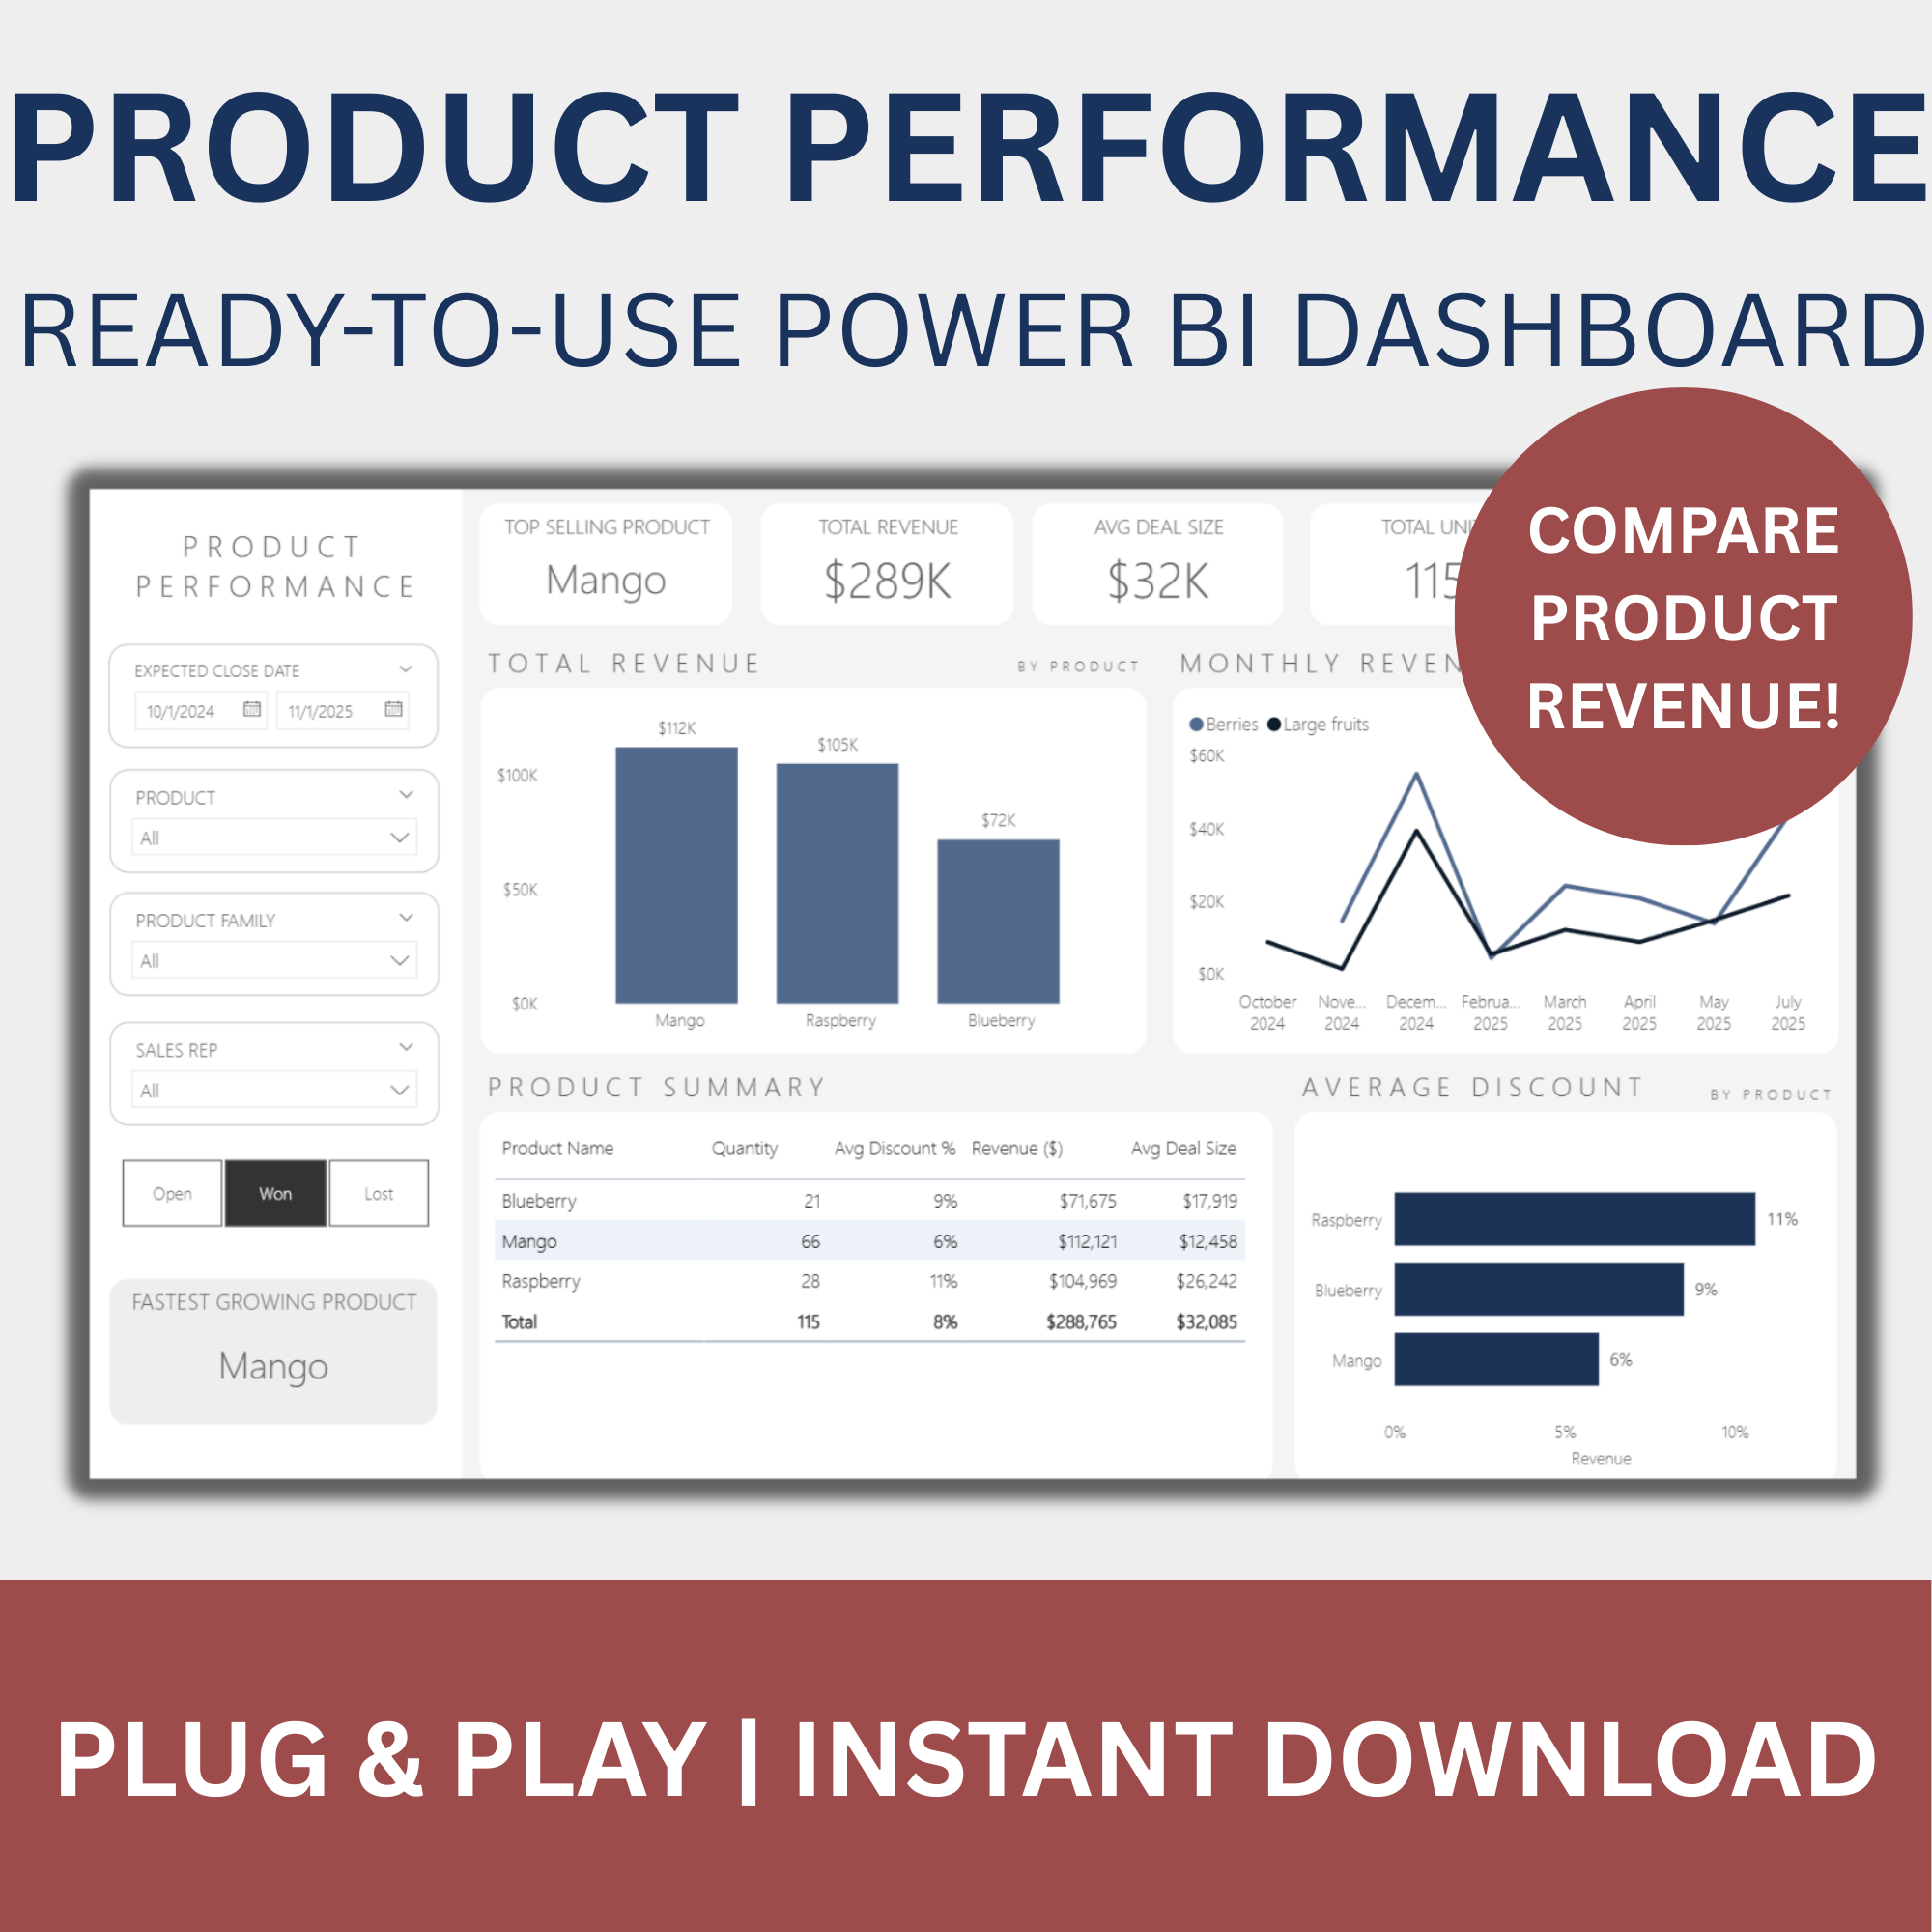
What You Get:
Power BI (.pbix) dashboard file
Excel data source
Data dictionary
Setup guide
Commercial use license
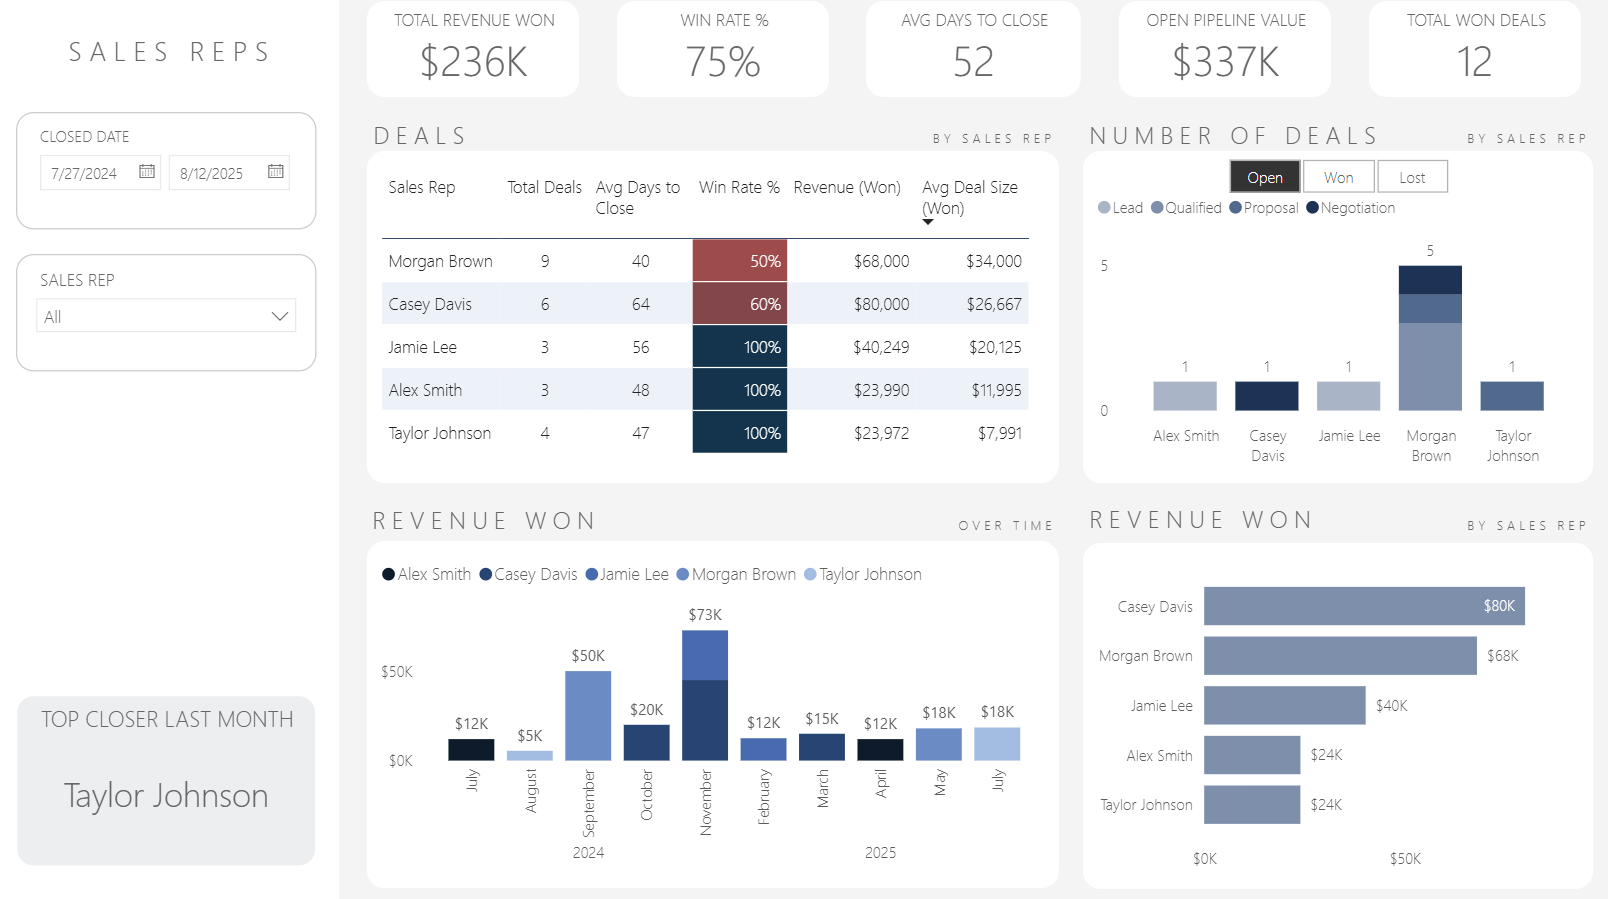
With flexible filters for Sales Rep, Stage, Status, Team, and Territory, this dashboard gives you targeted insights without the need to dig through raw CRM data.
Perfect for sales managers, executives, and account reps who want a fast, accurate view of pipeline health.
Gain complete visibility into your active sales funnel with the Sales Pipeline Dashboard. This dynamic, interactive dashboard tracks every stage of the sales process—from lead to close—helping you forecast revenue, monitor deal velocity, and optimize your pipeline for better results.
Whether you're managing a team or reviewing your own deals, this dashboard provides a clear, data-driven snapshot of where each opportunity stands and what actions are needed next.
Instant Digital Download — Your dashboard will be delivered to your email immediately after checkout. No waiting, no shipping.
Key questions this dashboard answers:
How many deals are currently in my pipeline, and at which stages?
What is the total pipeline value and average deal size?
How long are deals staying in each stage?
What’s my win rate and average days to close?
How does this year’s forecast compare to last year’s performance?
Actionable insights you’ll gain:
Identify bottlenecks where deals are stalling
Spot high-value opportunities at risk of delay
Track performance by sales stage to improve conversions
Compare current pipeline strength to historical benchmarks
Improve forecast accuracy with real-time metrics
What You Get:
Power BI (.pbix) dashboard file
Excel data source
Data dictionary
Setup guide
Commercial use license
With flexible filters for Sales Rep, Stage, Status, Team, and Territory, this dashboard gives you targeted insights without the need to dig through raw CRM data.
Perfect for sales managers, executives, and account reps who want a fast, accurate view of pipeline health.