 Image 1 of 2
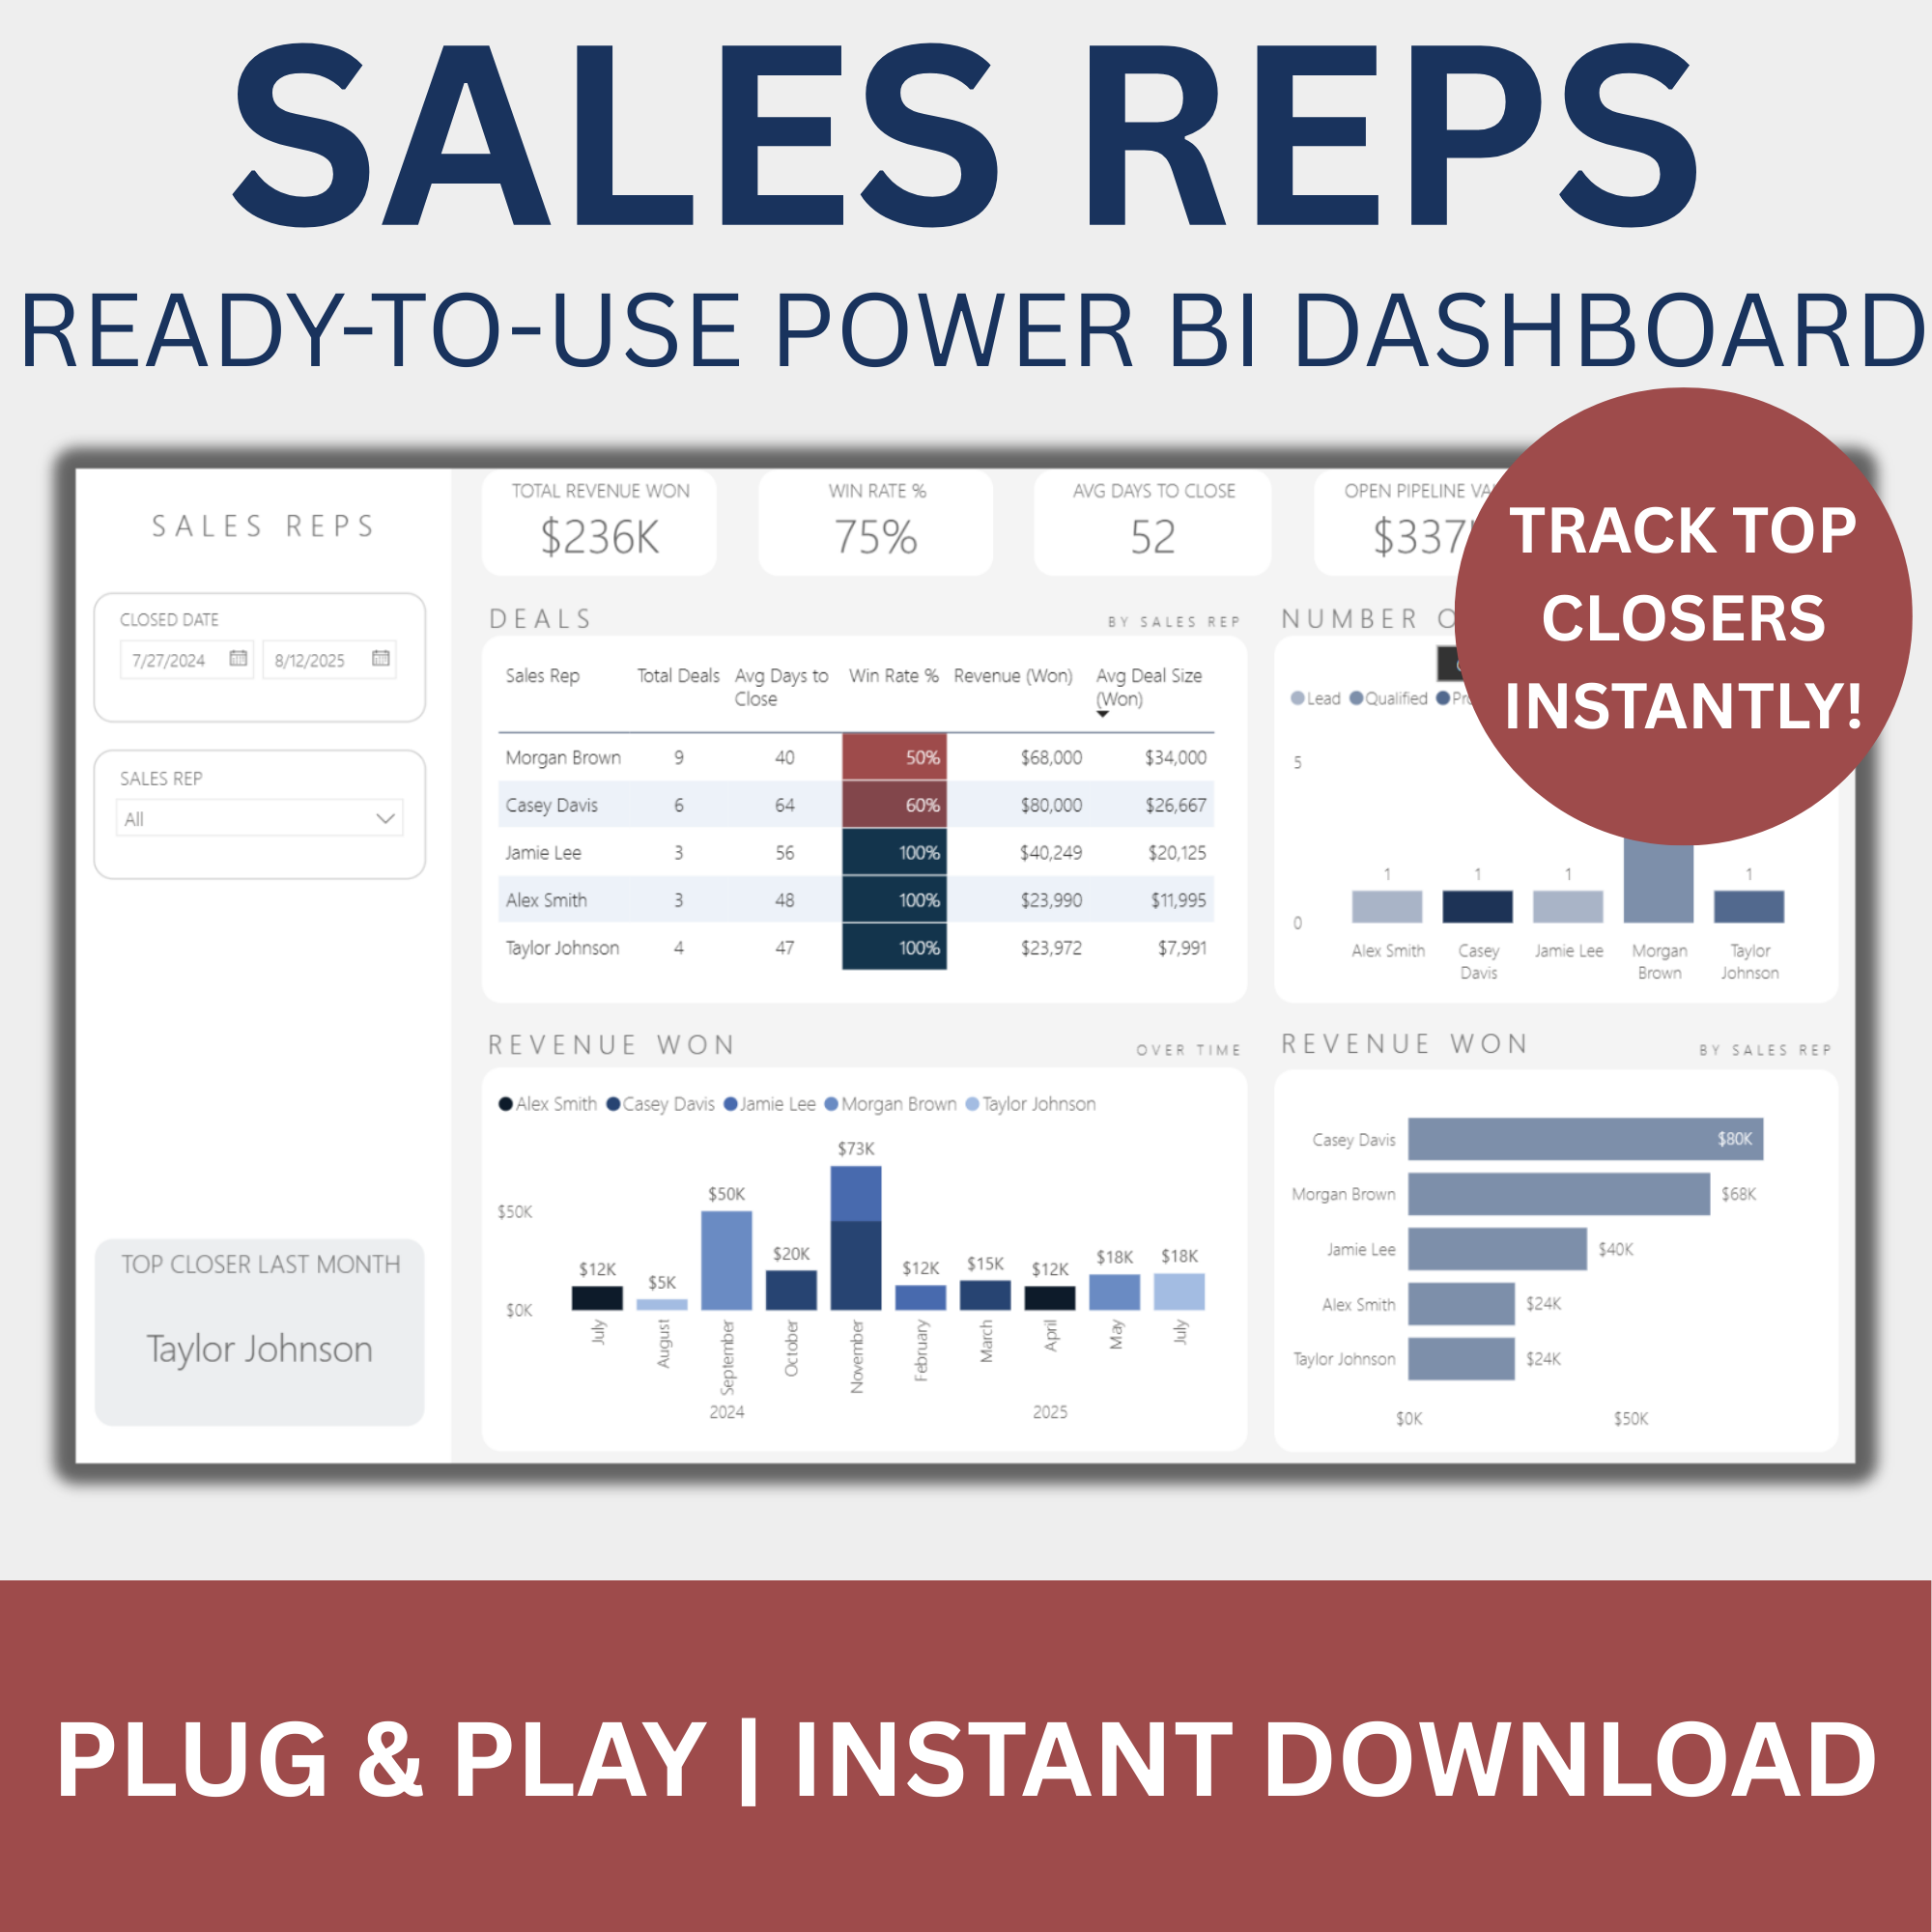 Image 2 of 2
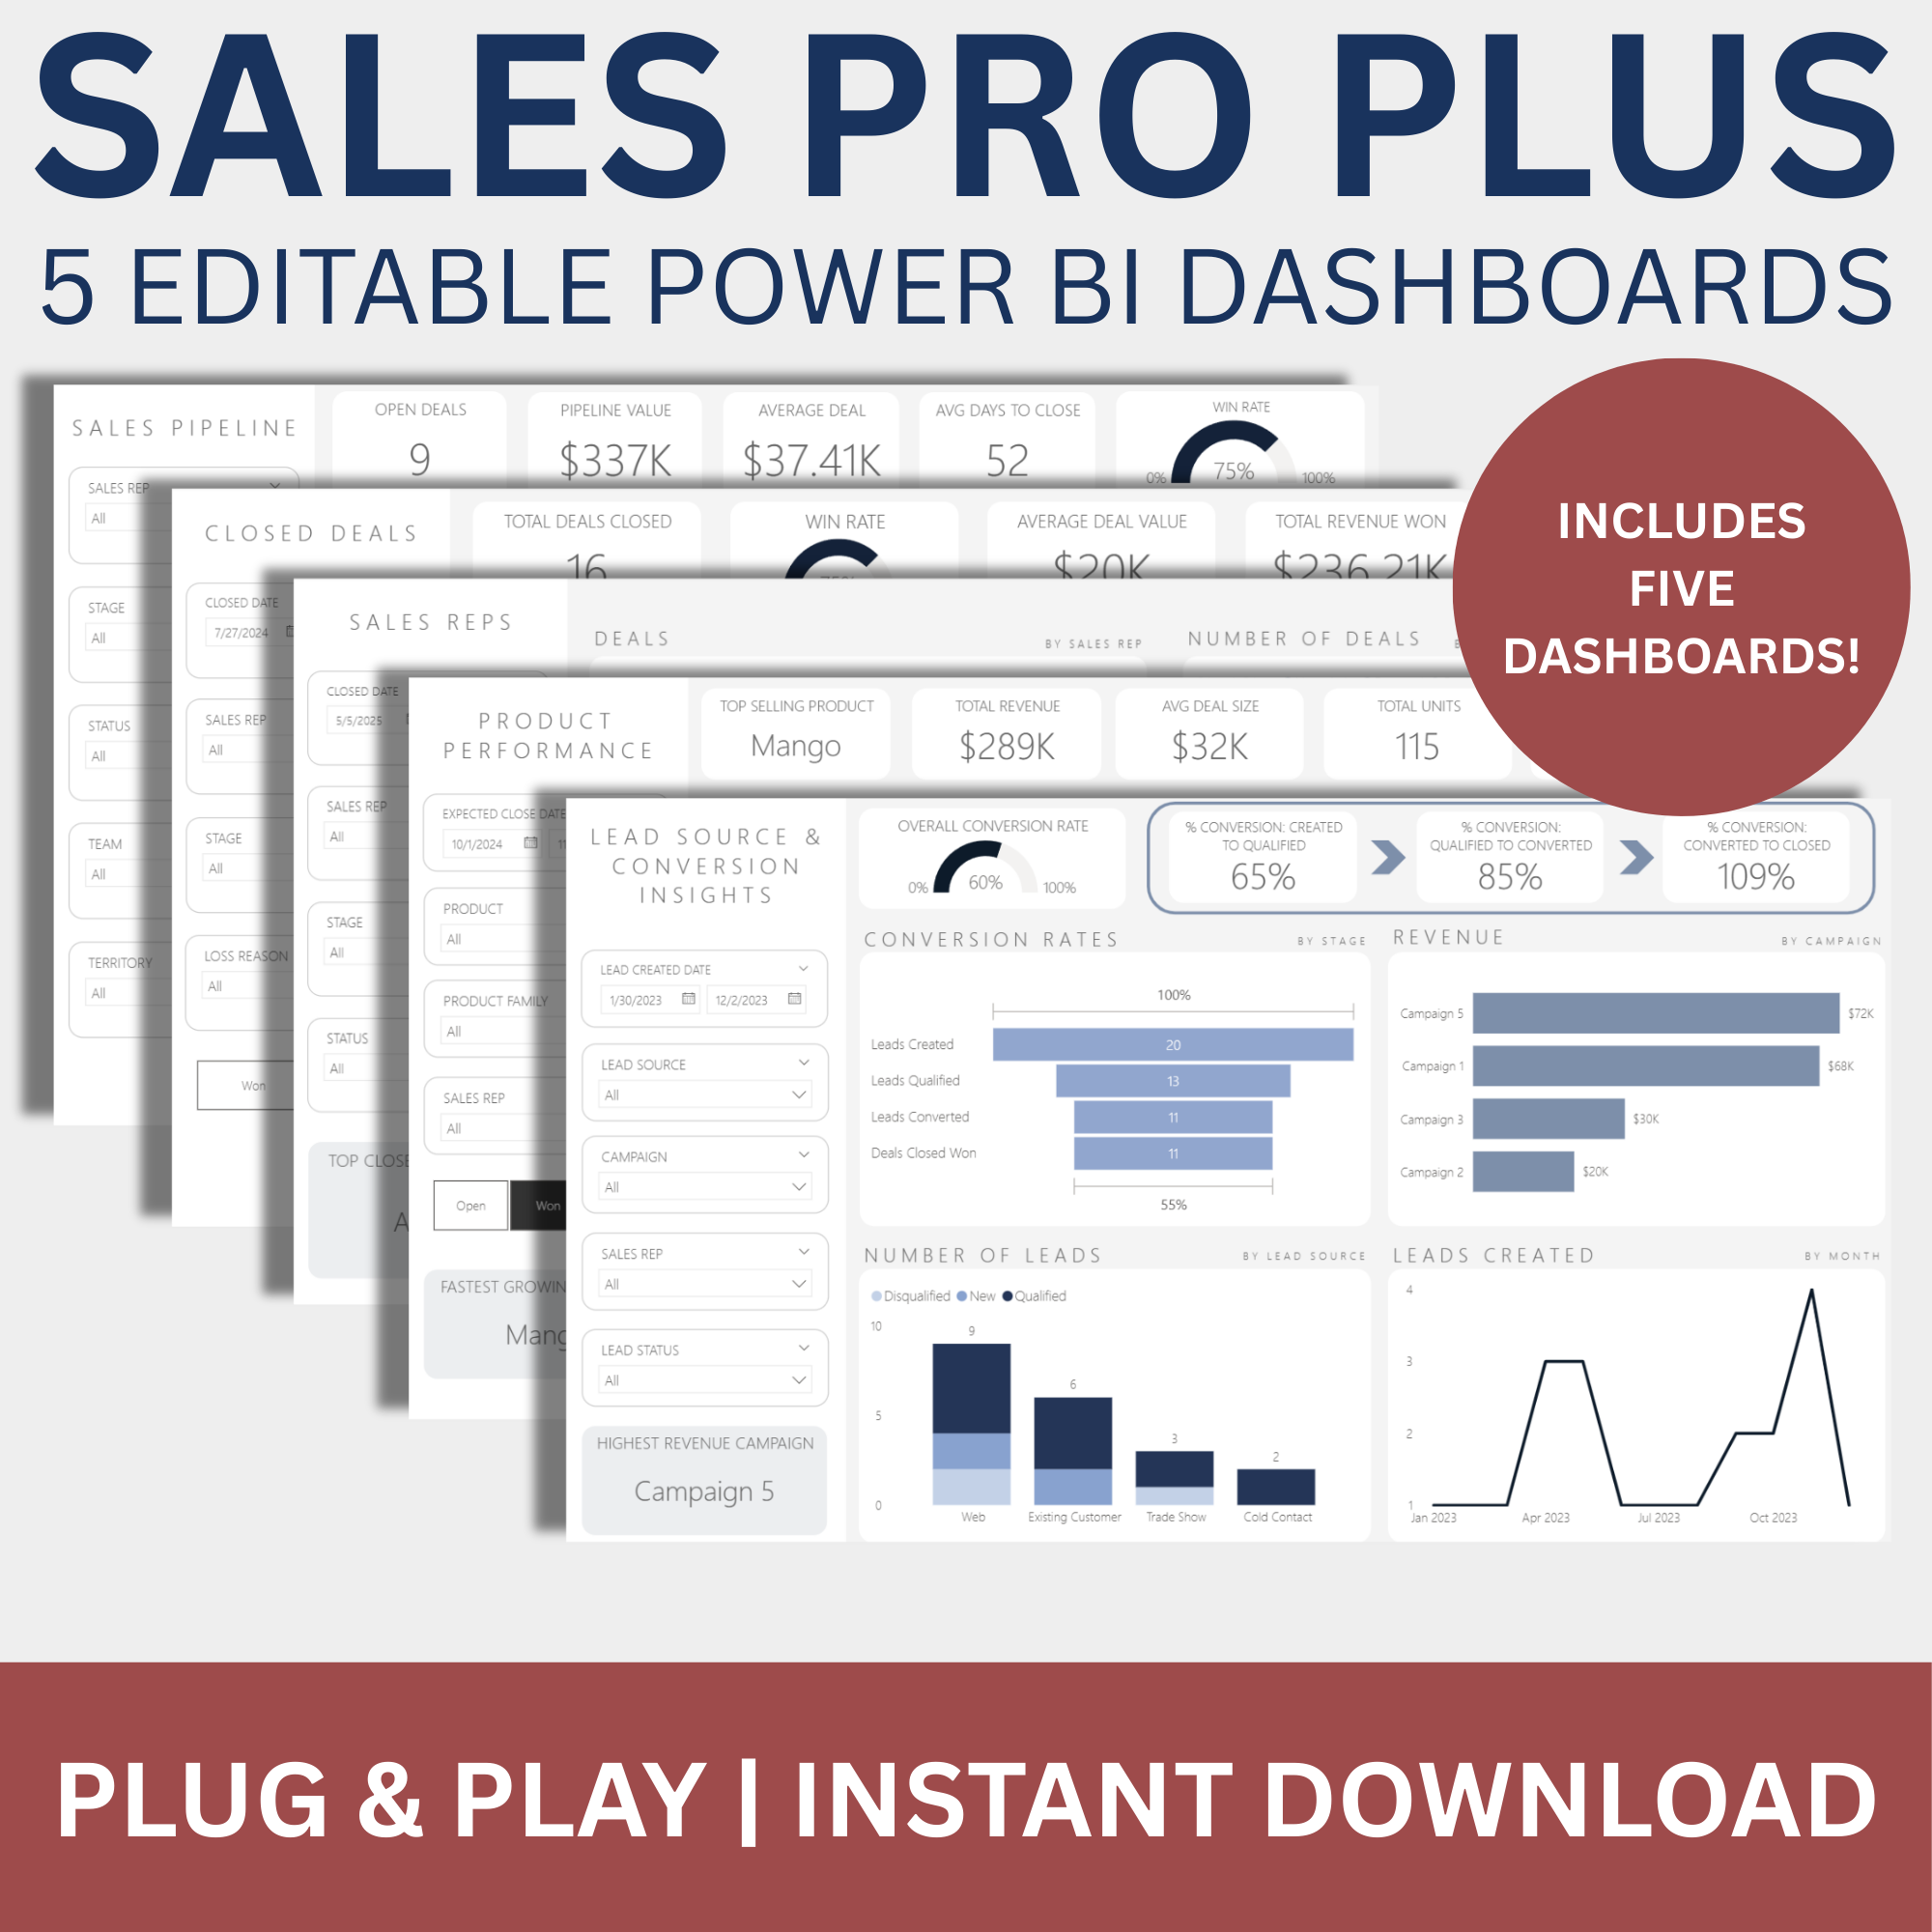
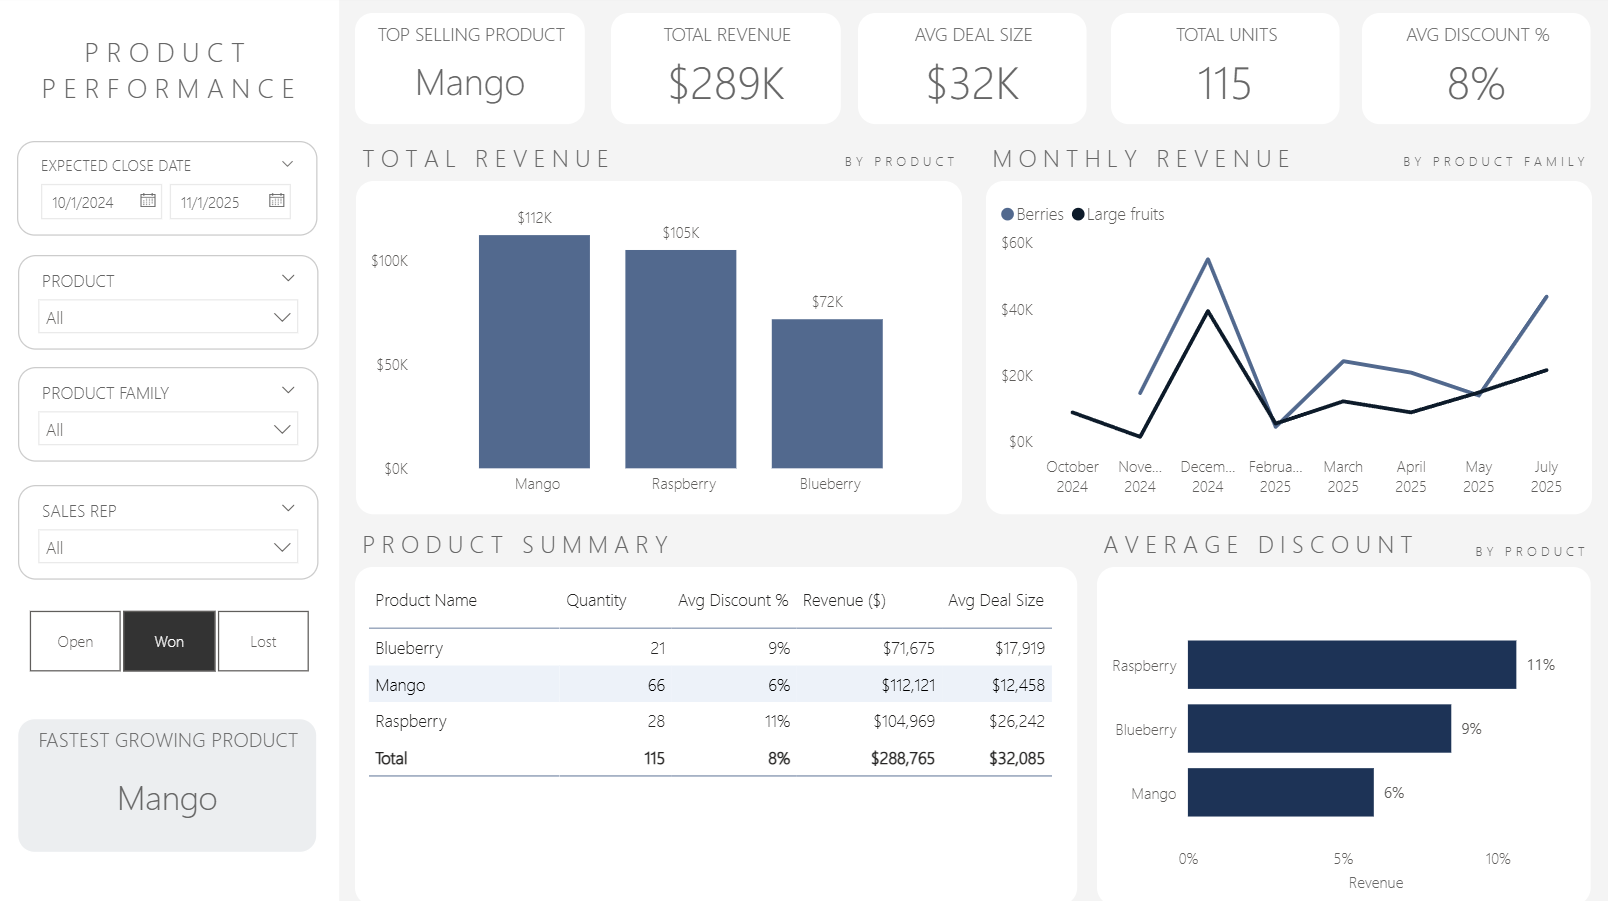
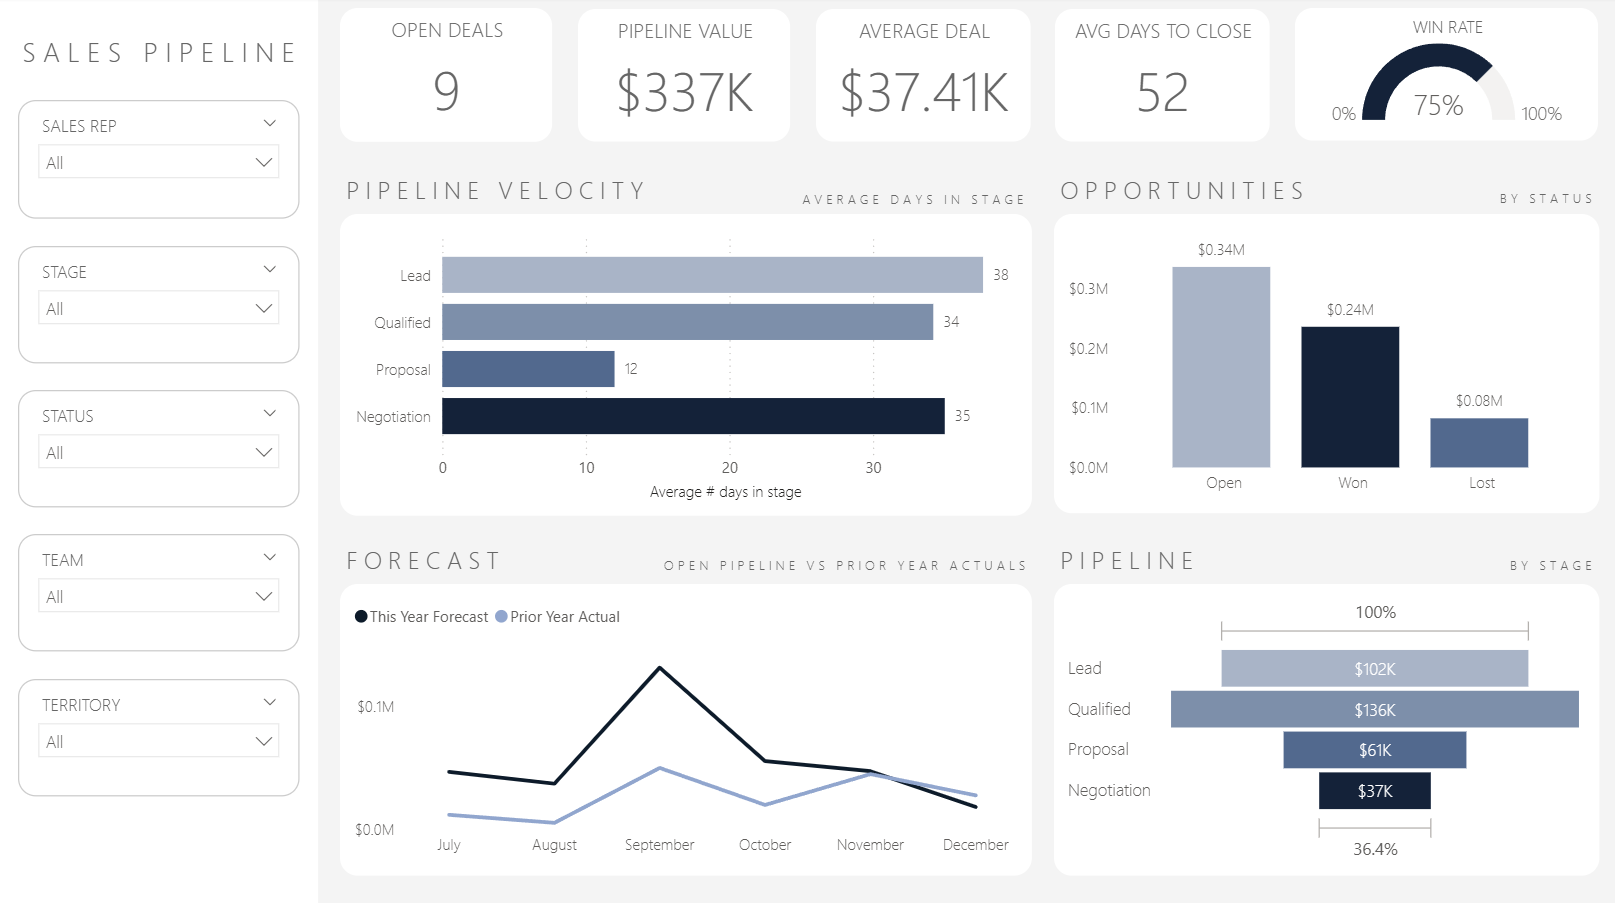
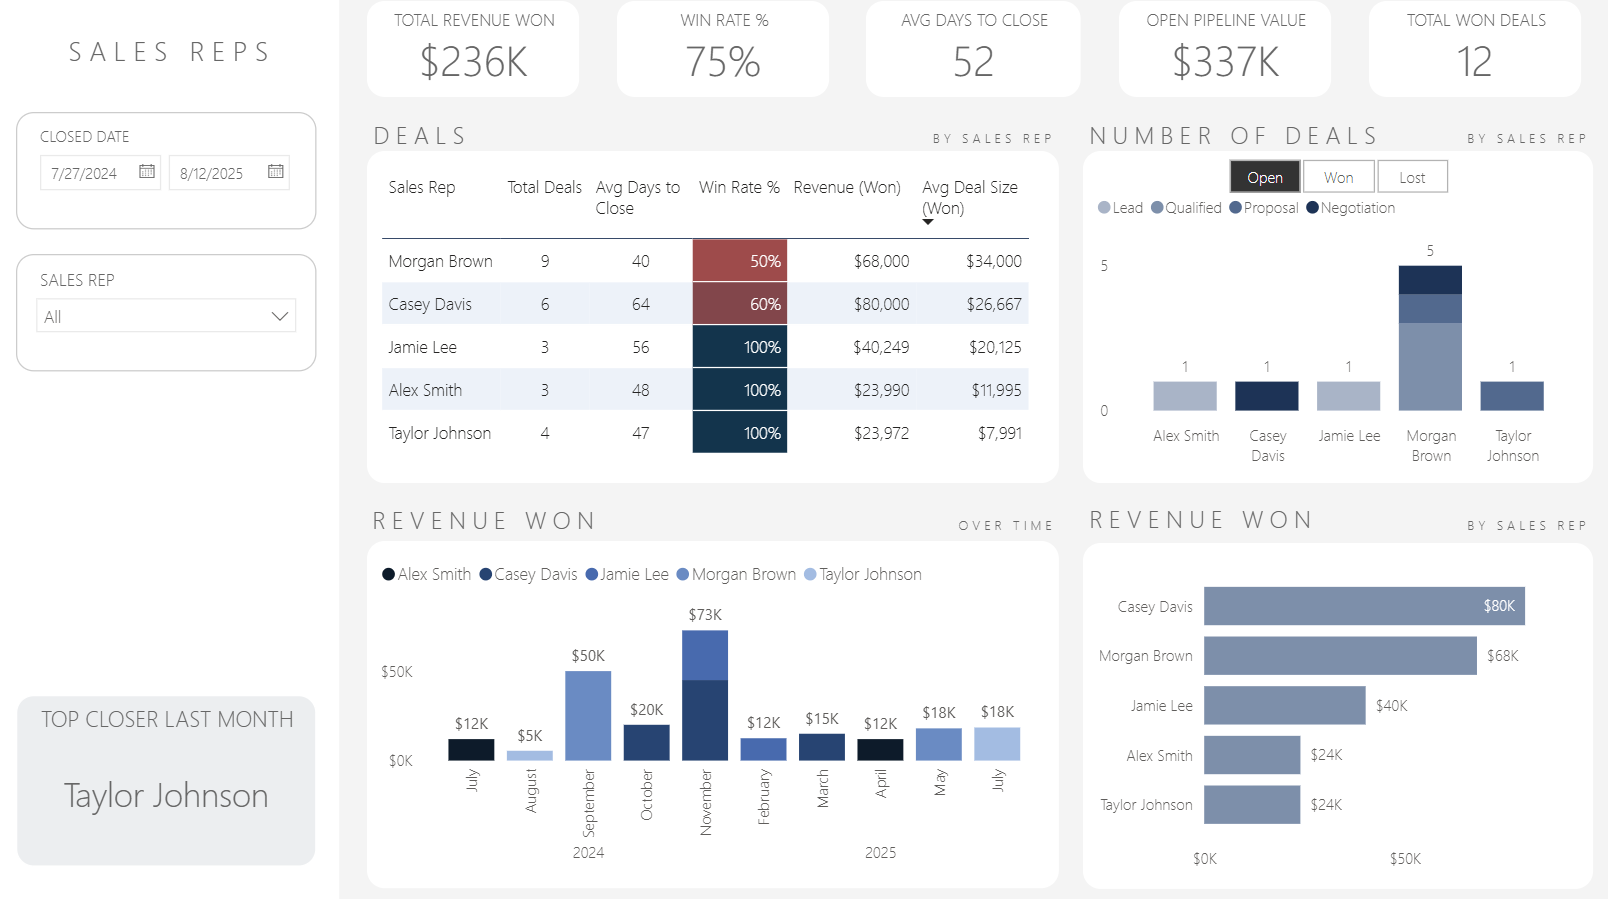
Quickly evaluate your sales team's performance with the Sales Reps Dashboard. This dashboard highlights key metrics like revenue won, win rate, deal velocity, and average deal size—giving you a full picture of each rep’s strengths and opportunities.
Track how reps are performing individually and as a team over time. Whether you're a sales manager, executive, or individual rep, this dashboard delivers clear, actionable insights to drive coaching, recognition, and results.
Instant Digital Download — Your dashboard will be delivered to your email immediately after checkout. No waiting, no shipping.
Key questions this dashboard answers:
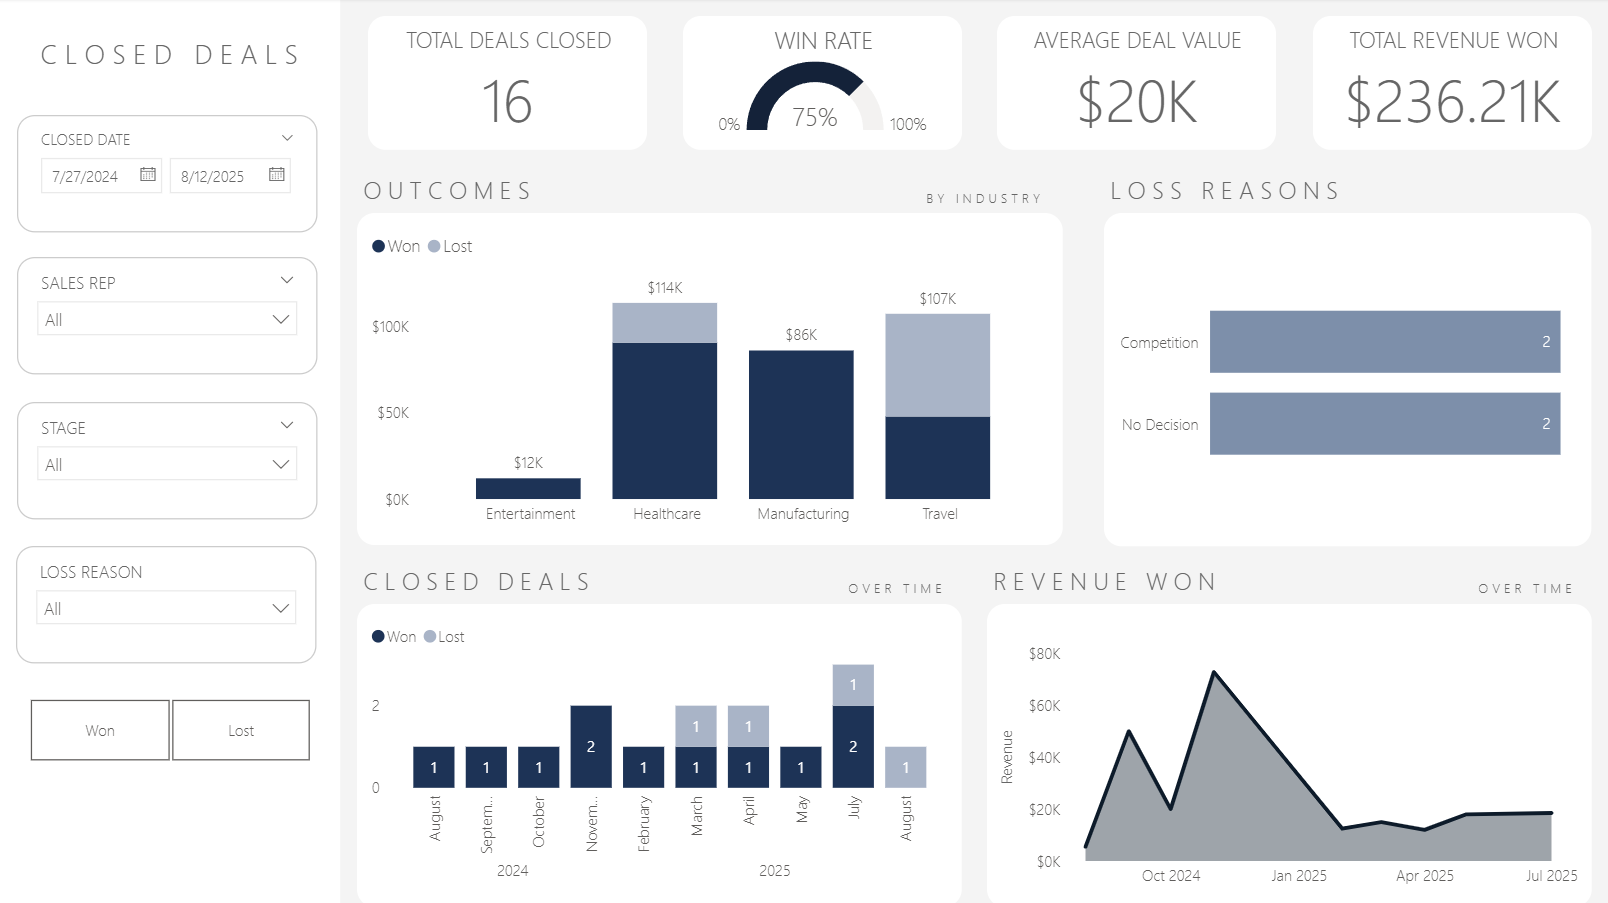
Which sales reps are winning the most revenue?
Who has the highest win rate and fastest close time?
What is the average deal size per rep?
How many deals has each rep opened, won, or lost?
How is revenue trending over time by rep?
Actionable insights you’ll gain:
Recognize top performers and identify coaching needs
Compare win rates and deal outcomes across the team
Monitor pipeline activity by rep and stage
Improve forecast accuracy with rep-level insights
Analyze performance trends over time to adjust strategies
What You Get:
Power BI (.pbix) dashboard file
Excel data source
Data dictionary
Setup guide
Commercial use license
The dashboard includes filters for closed date and sales rep, making it easy to customize views for quarterly reviews, one-on-ones, or leadership reporting.
Perfect for sales leaders, team managers, and reps who want a clear view of what’s working and how to improve.
Quickly evaluate your sales team's performance with the Sales Reps Dashboard. This dashboard highlights key metrics like revenue won, win rate, deal velocity, and average deal size—giving you a full picture of each rep’s strengths and opportunities.
Track how reps are performing individually and as a team over time. Whether you're a sales manager, executive, or individual rep, this dashboard delivers clear, actionable insights to drive coaching, recognition, and results.
Instant Digital Download — Your dashboard will be delivered to your email immediately after checkout. No waiting, no shipping.
Key questions this dashboard answers:
Which sales reps are winning the most revenue?
Who has the highest win rate and fastest close time?
What is the average deal size per rep?
How many deals has each rep opened, won, or lost?
How is revenue trending over time by rep?
Actionable insights you’ll gain:
Recognize top performers and identify coaching needs
Compare win rates and deal outcomes across the team
Monitor pipeline activity by rep and stage
Improve forecast accuracy with rep-level insights
Analyze performance trends over time to adjust strategies
What You Get:
Power BI (.pbix) dashboard file
Excel data source
Data dictionary
Setup guide
Commercial use license
The dashboard includes filters for closed date and sales rep, making it easy to customize views for quarterly reviews, one-on-ones, or leadership reporting.
Perfect for sales leaders, team managers, and reps who want a clear view of what’s working and how to improve.