 Image 1 of 2
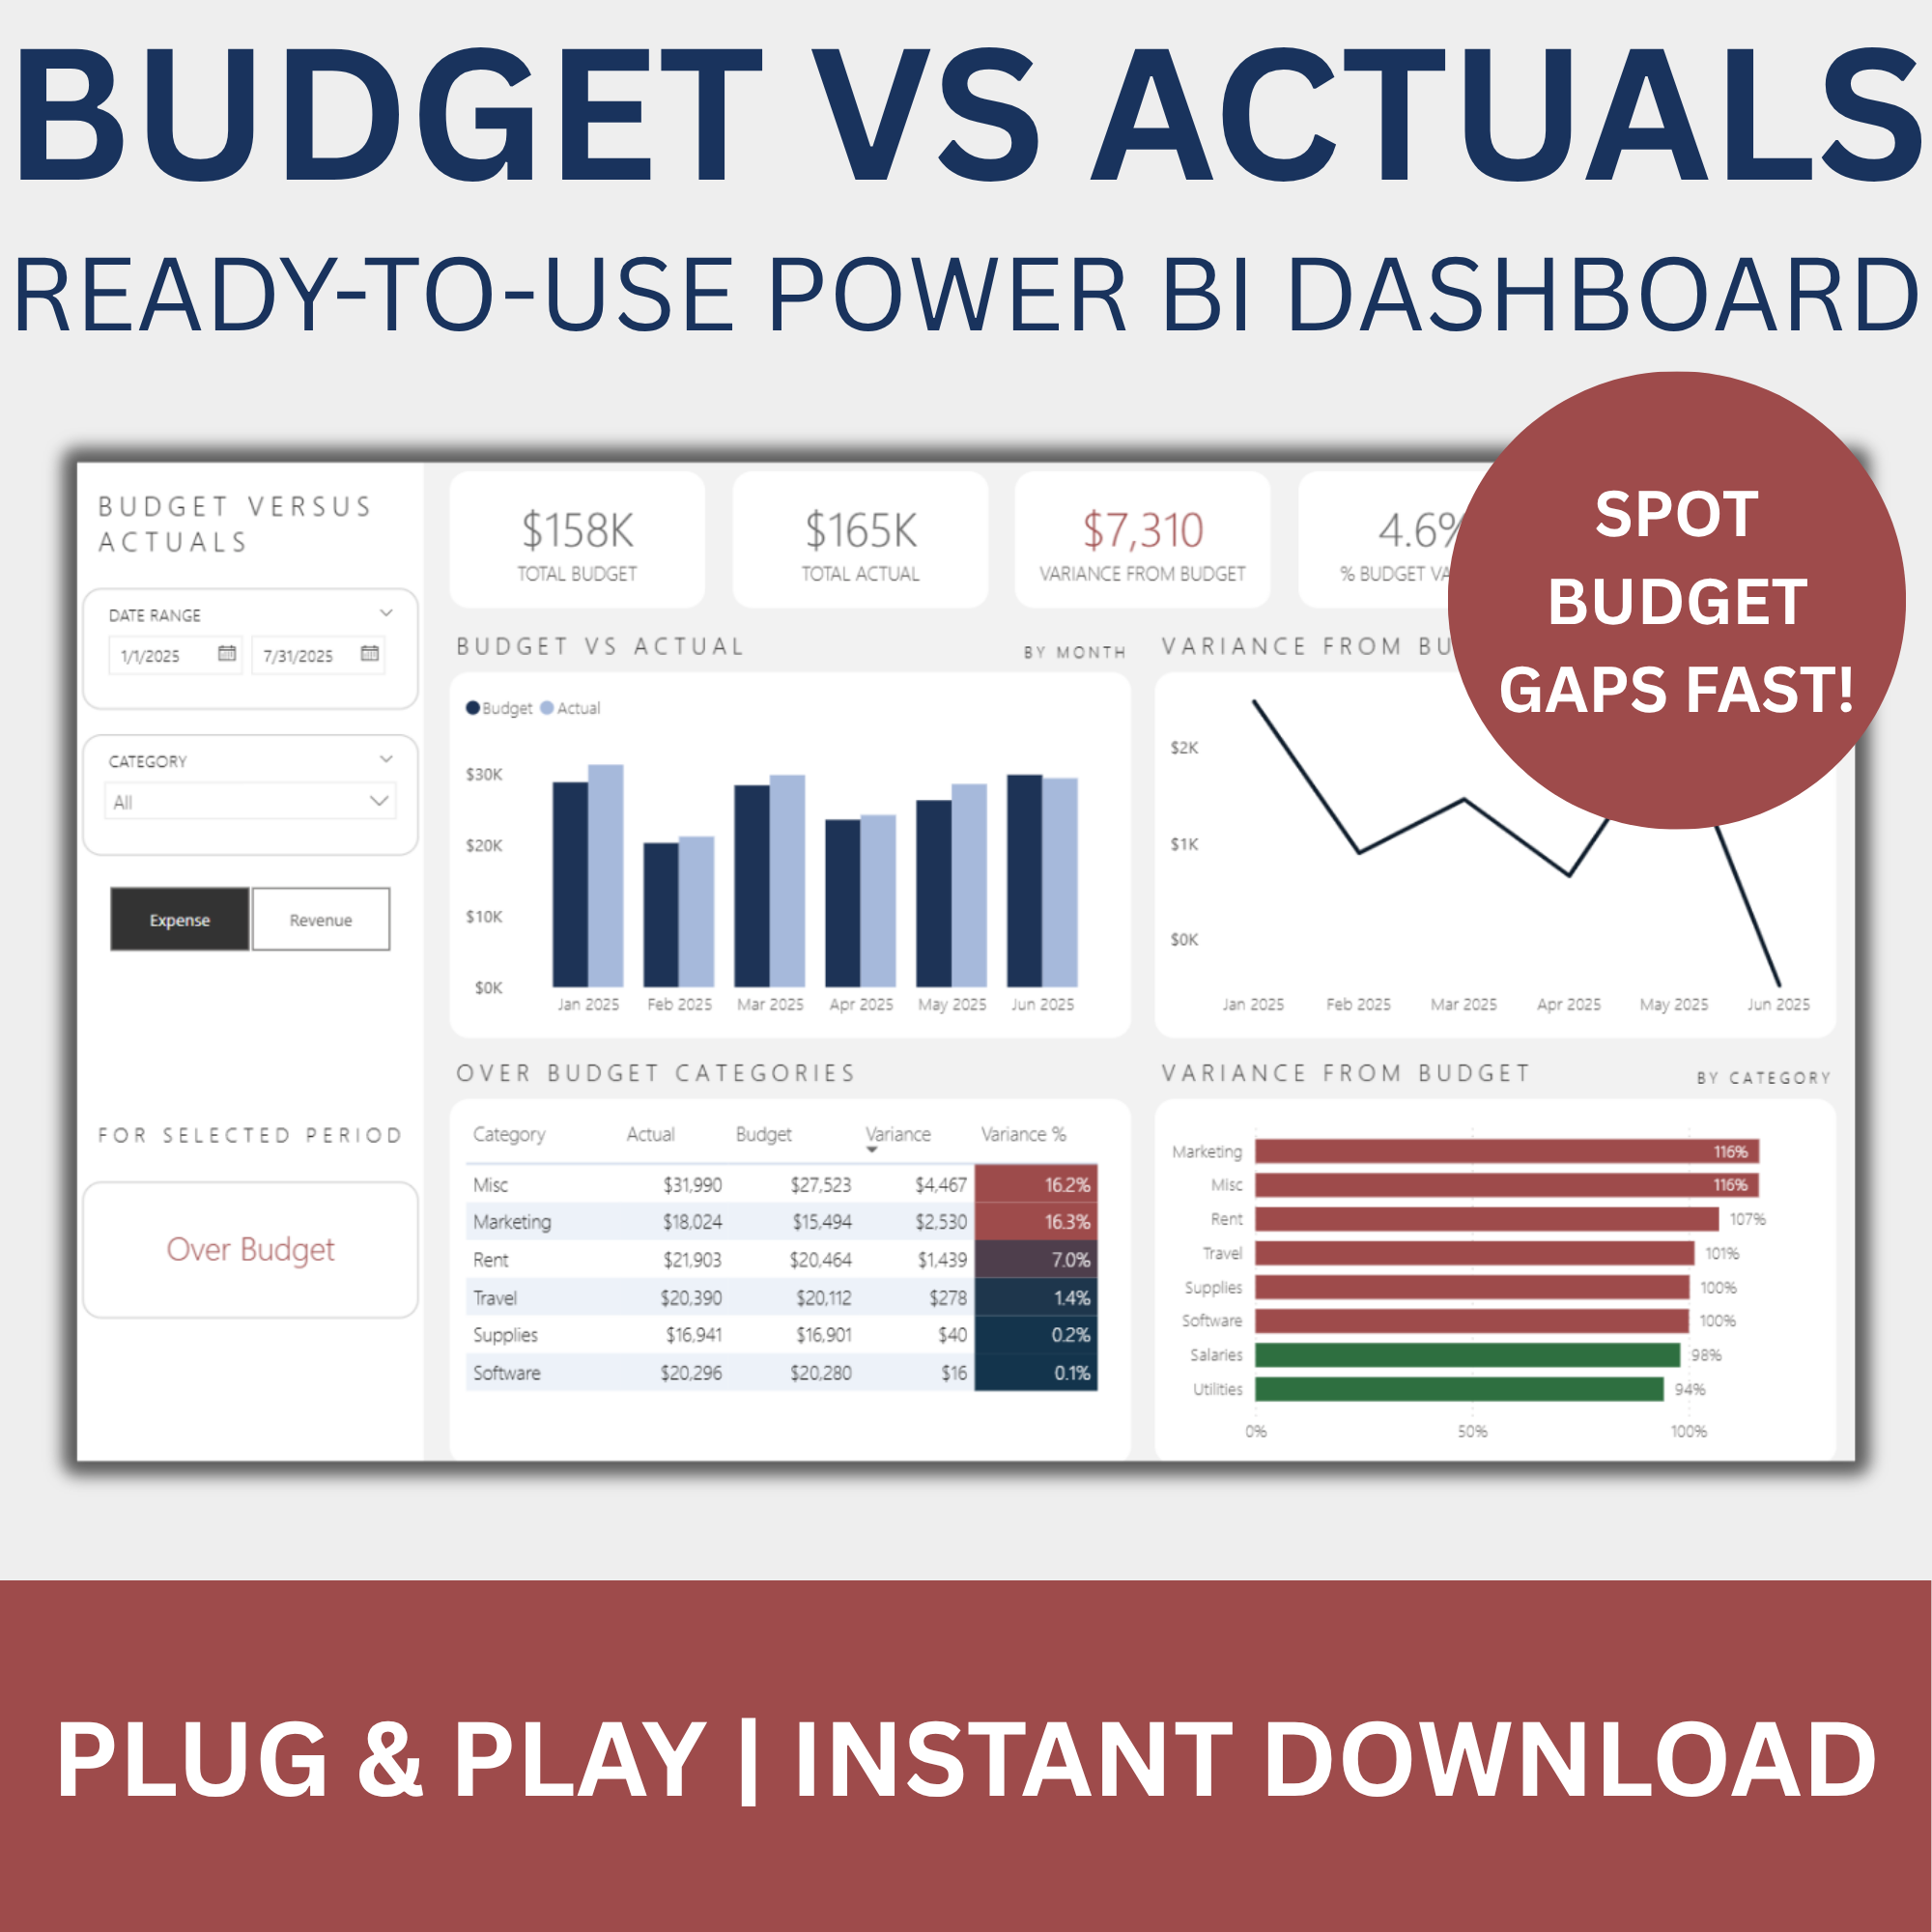 Image 2 of 2
Budget vs Actuals Dashboard
$39.00
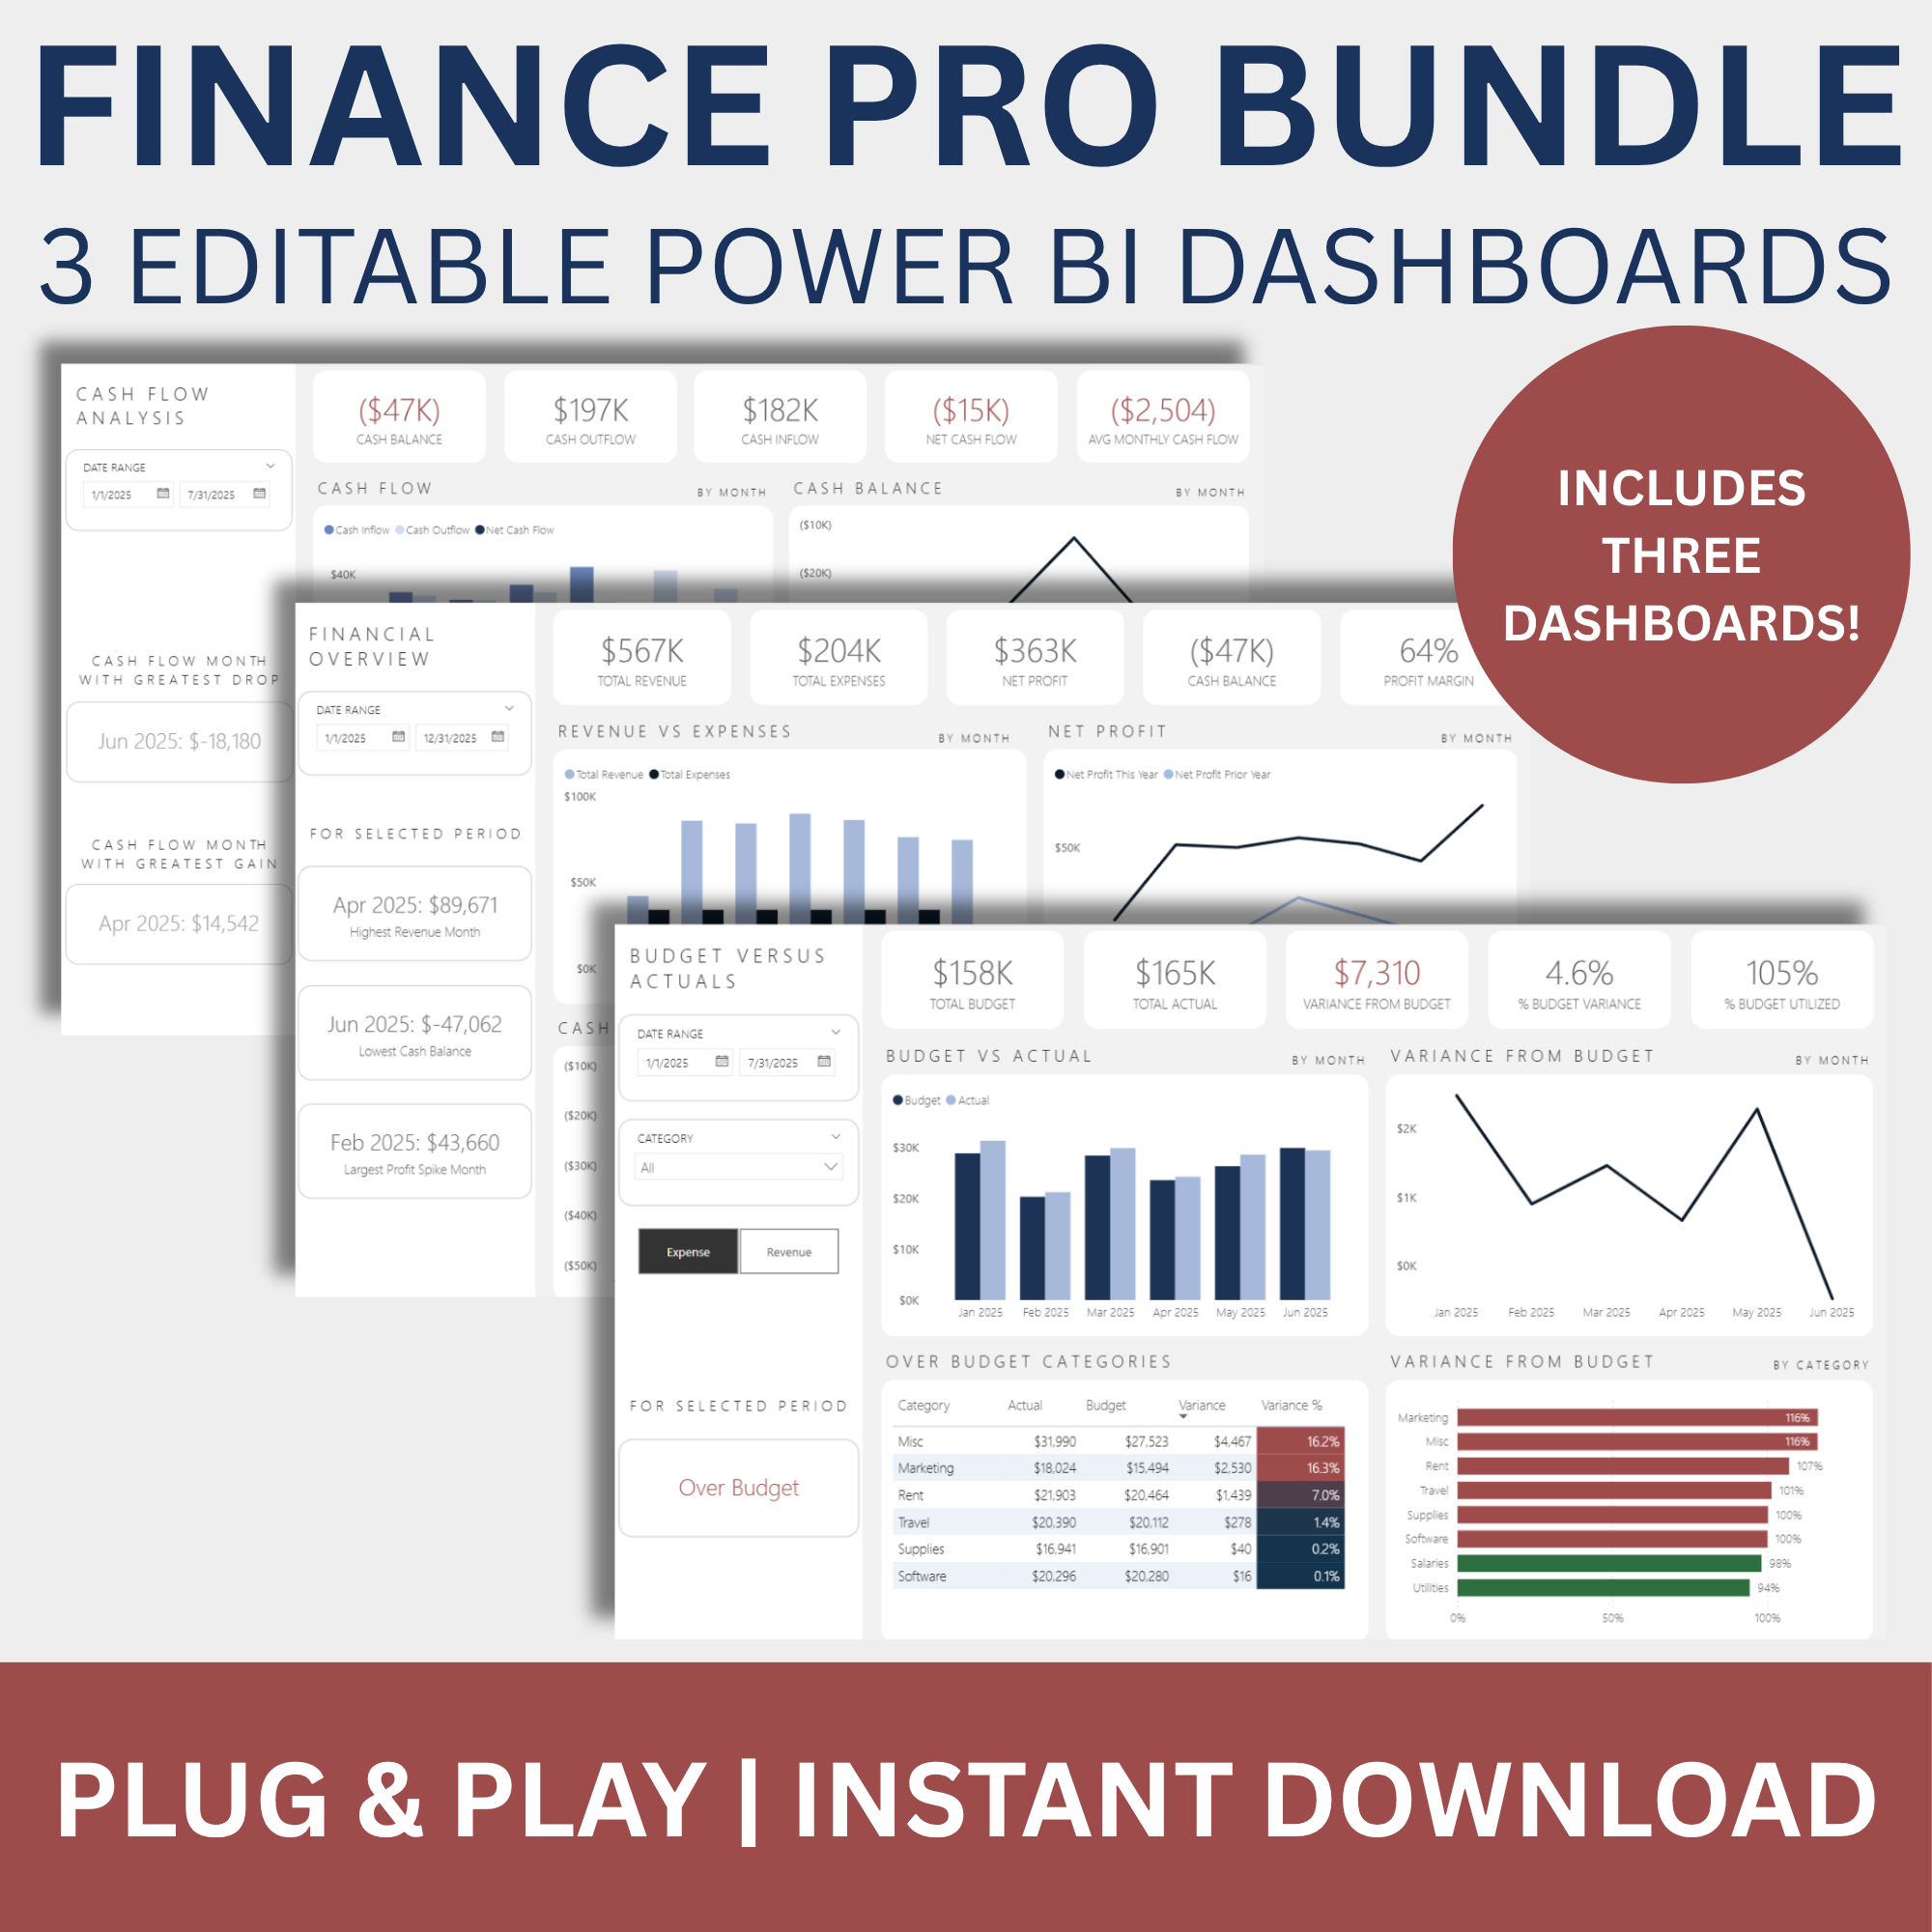
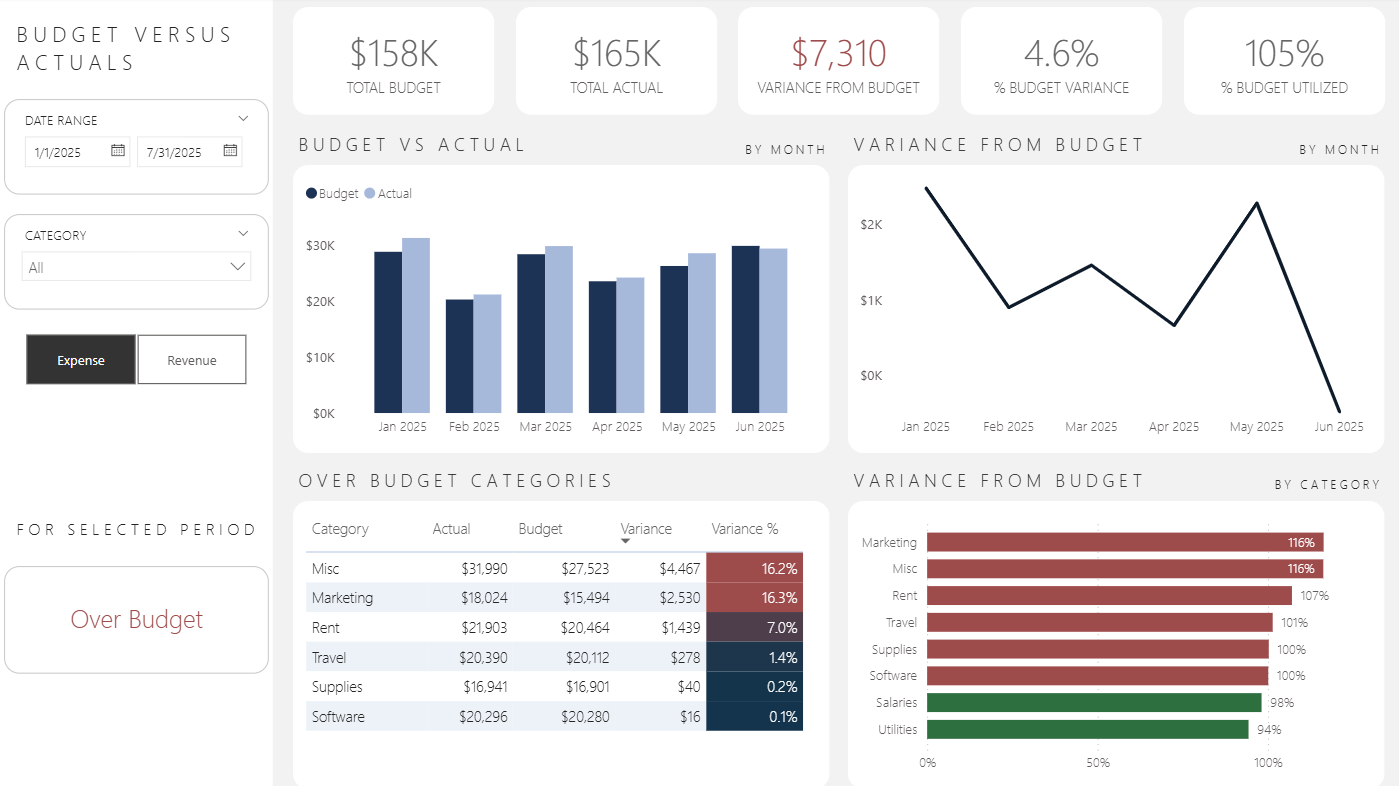
Gain full visibility into your financial performance with the Budget vs Actuals Dashboard. This dashboard compares planned budgets against actual spend or revenue—helping you understand where you're over or under budget, and why.
With dynamic variance analysis by category and time period, it's the perfect tool for finance teams, budget owners, and business leaders who need to monitor spending patterns, uncover inefficiencies, and stay financially on track.
Instant Digital Download — Your dashboard will be delivered to your email immediately after checkout. No waiting, no shipping.
Key questions this dashboard answers:
Are we over or under budget this month, quarter, or year?
Which categories have the highest variance?
How does actual spend compare to our plan over time?
What’s the total variance (in dollars and percent)?
How well are we utilizing our budget?
Actionable insights you’ll gain:
Instantly identify over-budget categories and cost drivers
Track how variance trends evolve month over month
Optimize budget allocations with performance visibility
Monitor expense vs revenue budget adherence
Support financial accountability across teams or departments
What You Get:
Power BI (.pbix) dashboard file
Excel data source
Data dictionary
Setup guide
Commercial use license
Includes filters for date range and category, plus a toggle between Expense and Revenue analysis—giving you full flexibility to tailor your view.
Whether you’re managing a single department or the entire organization, this dashboard keeps your budget aligned with reality—and your strategy grounded in data.