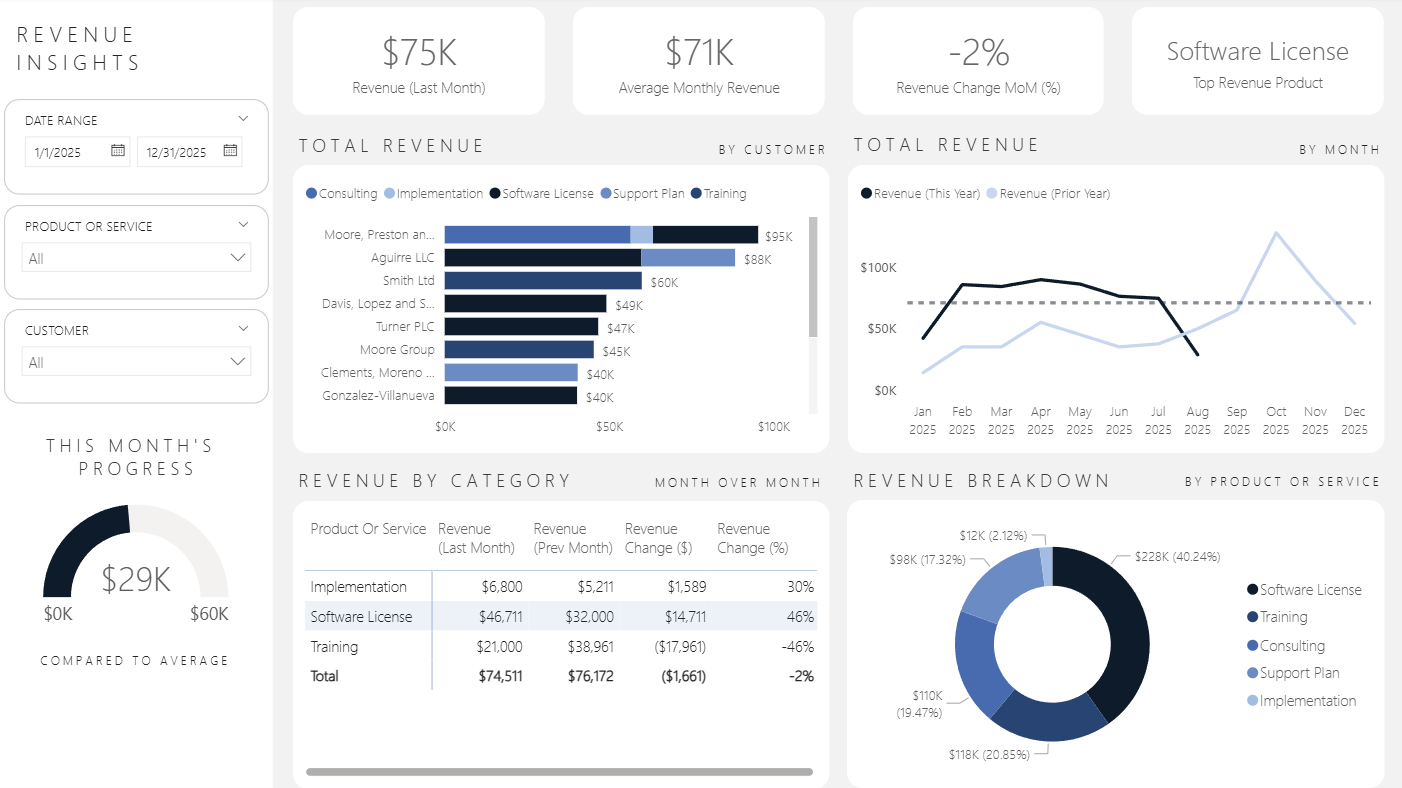
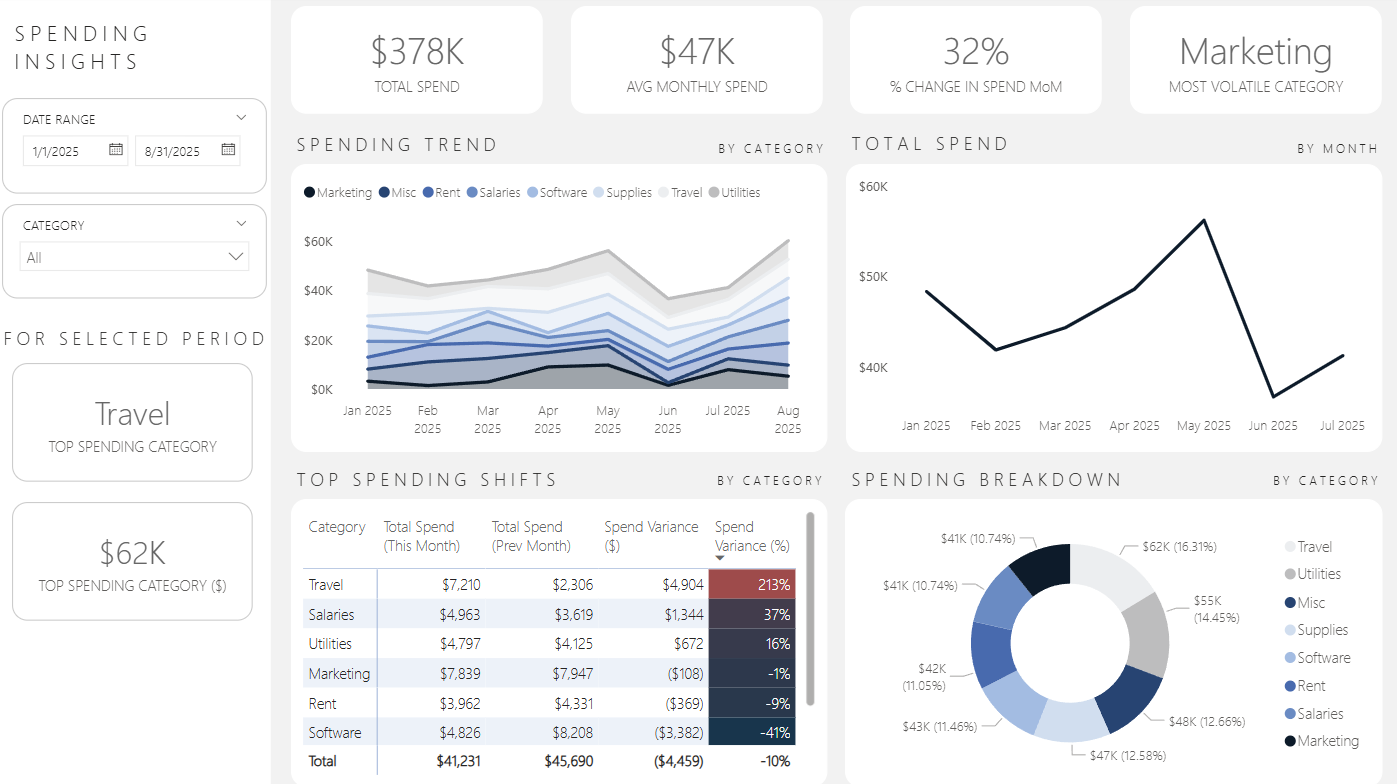
Get full visibility into your business finances with this Finance Dashboard Bundle — a collection of three executive-ready Power BI templates designed to track spending, measure profitability, and monitor cash flow with ease.
Whether you're a small business owner, finance manager, or consultant, this bundle equips you with the tools to make confident, data-driven decisions without digging through spreadsheets.
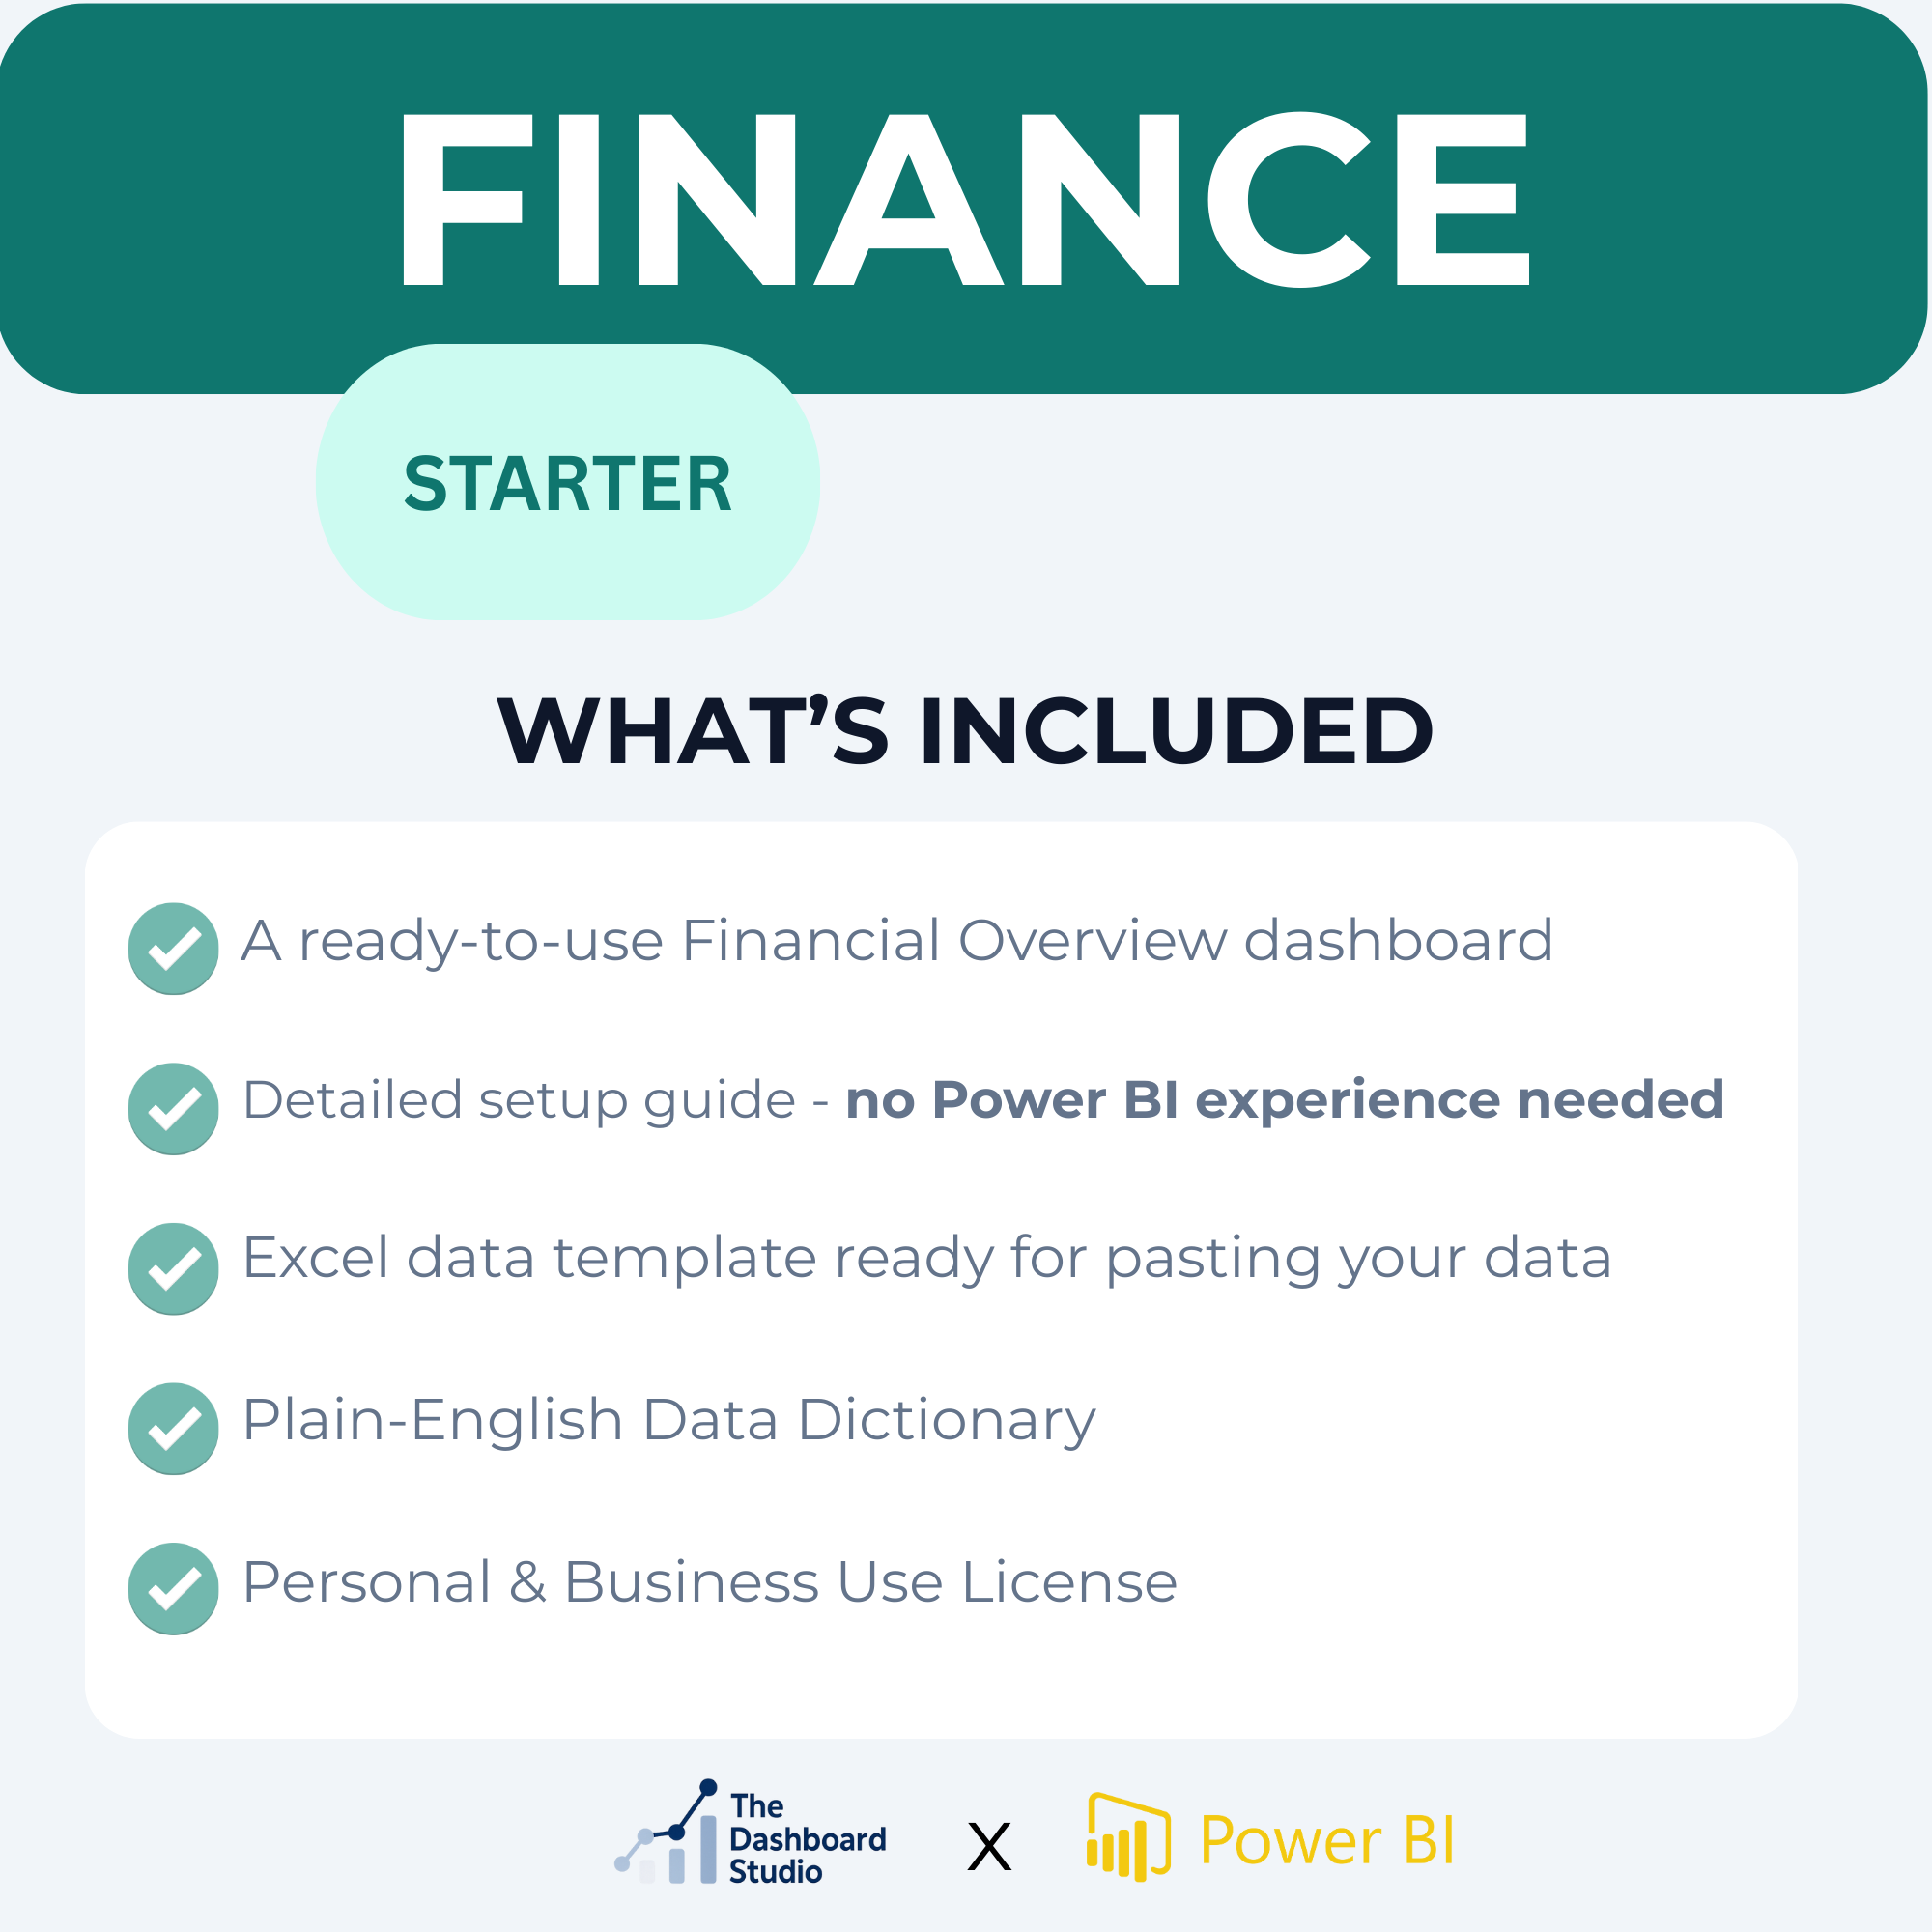
Instant Digital Download — Your dashboards will be delivered to your email immediately after checkout. No waiting, no shipping.
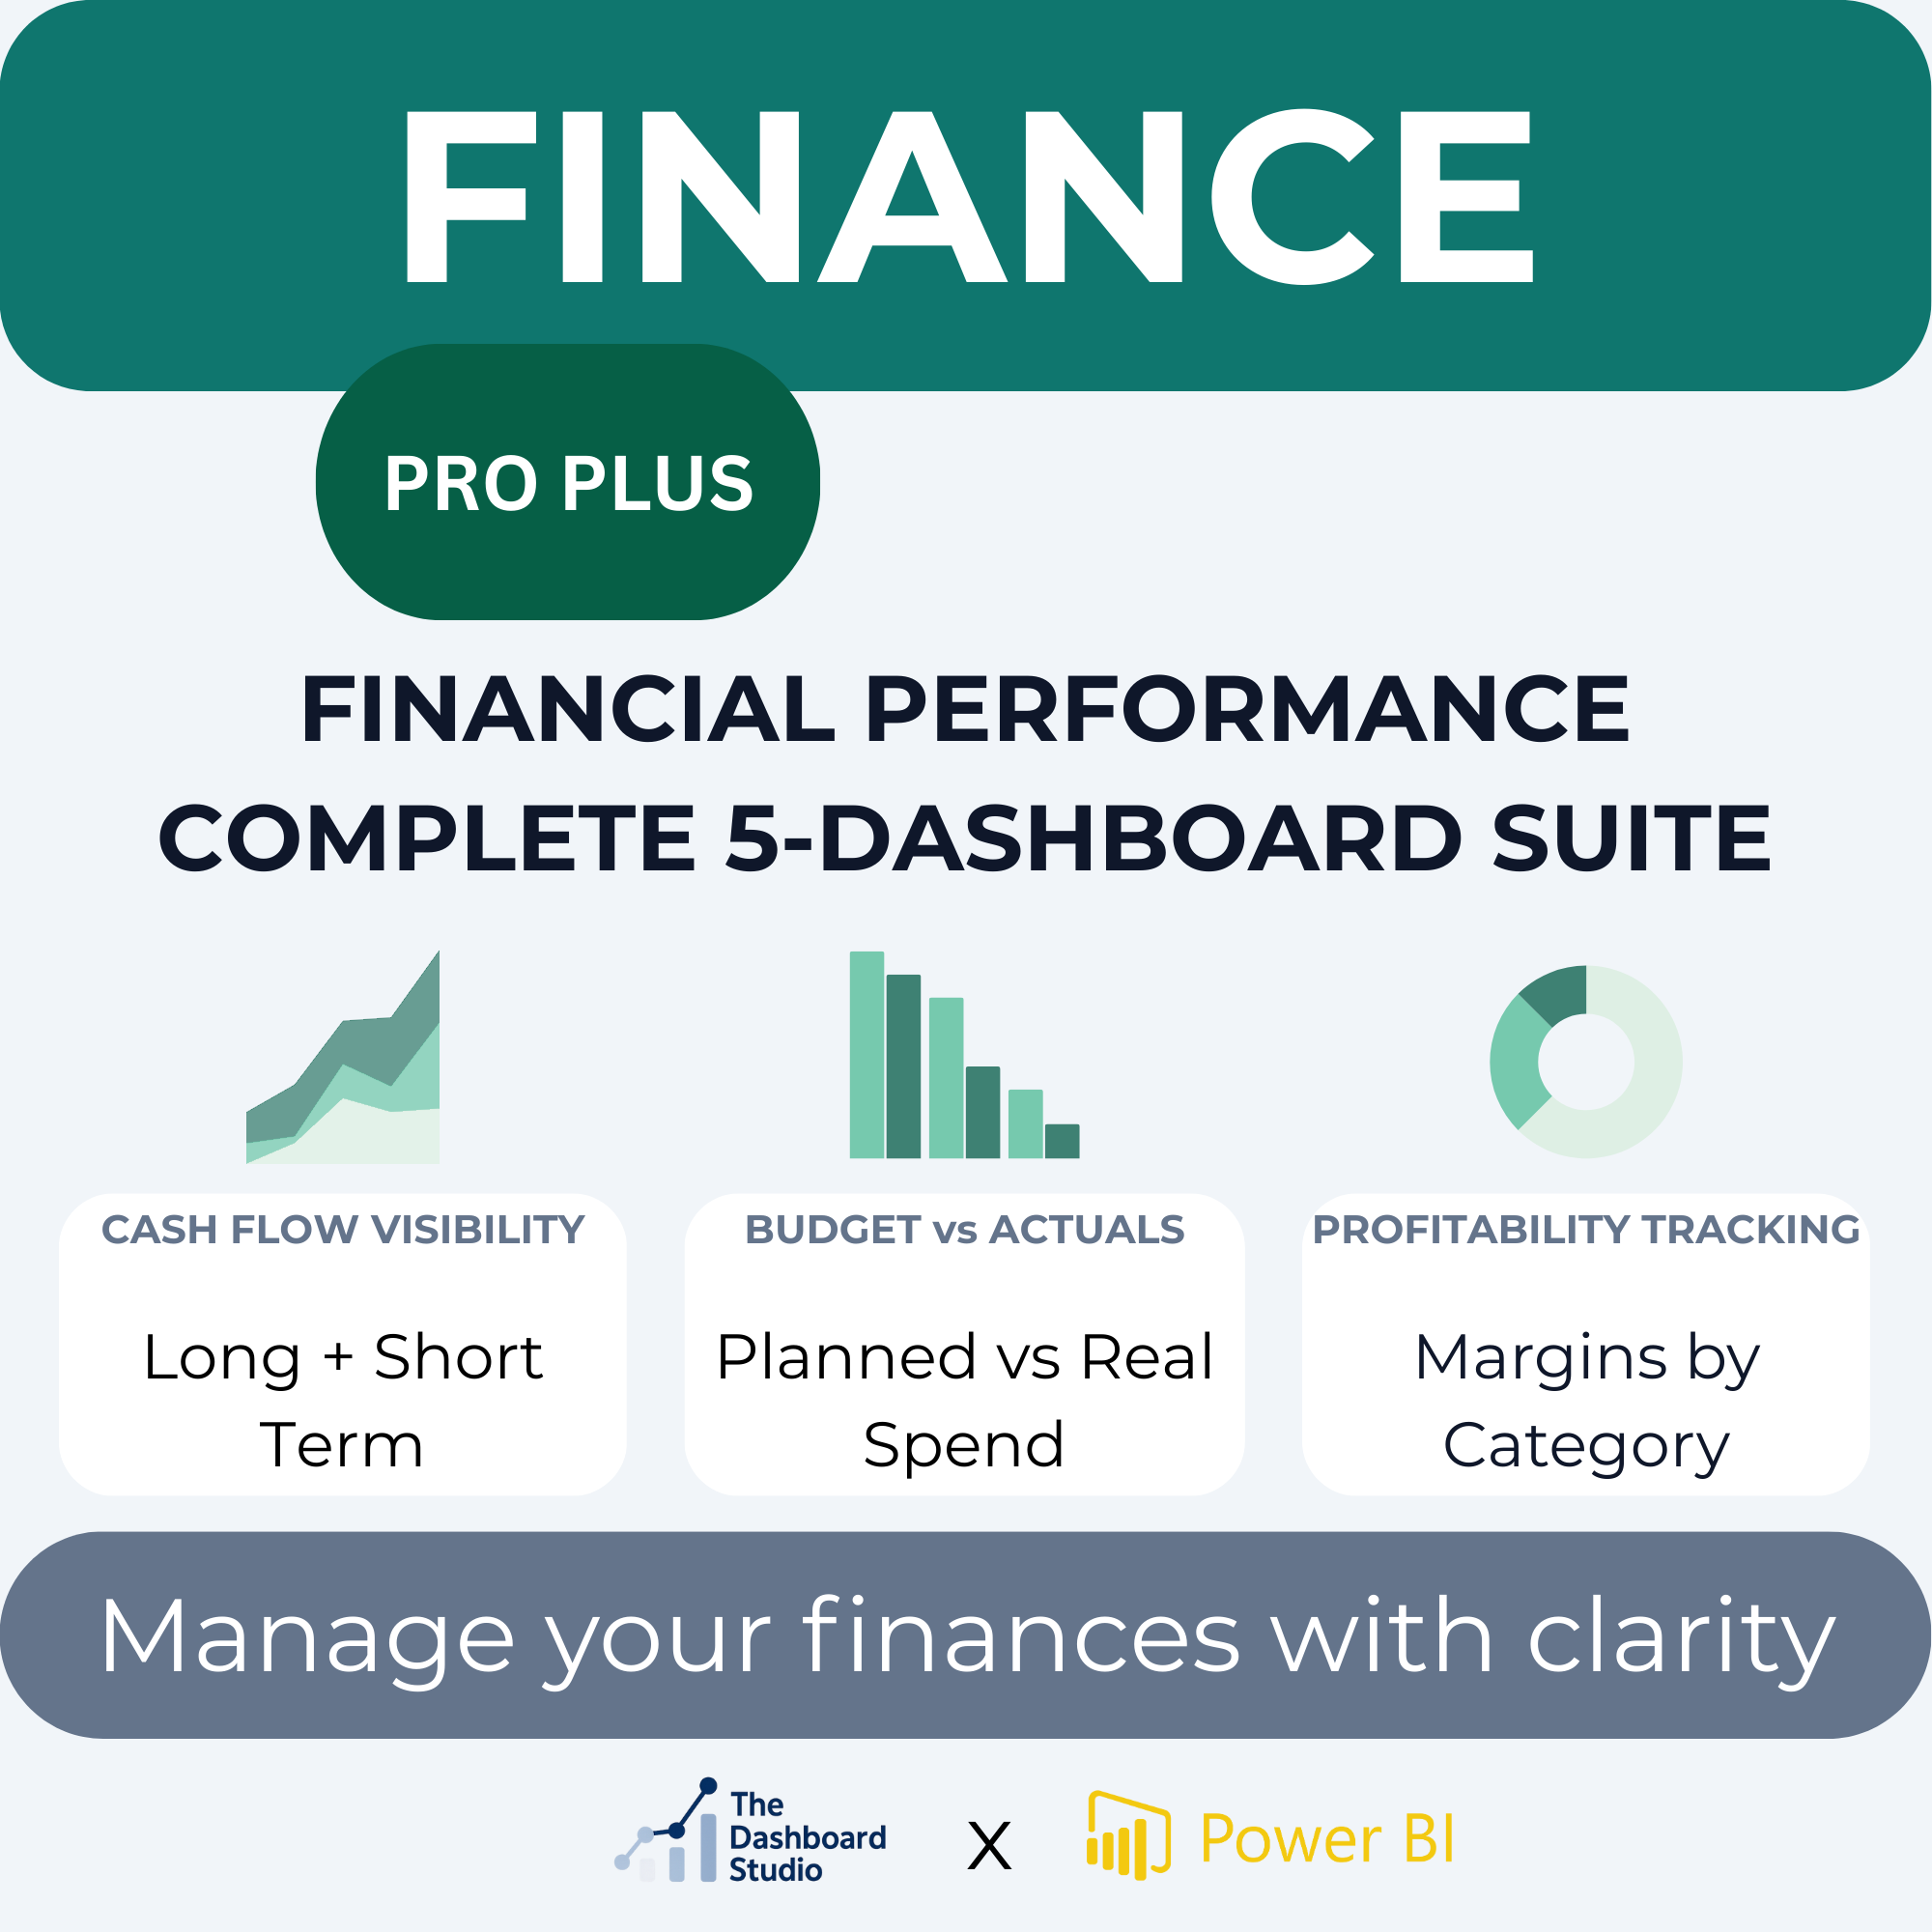
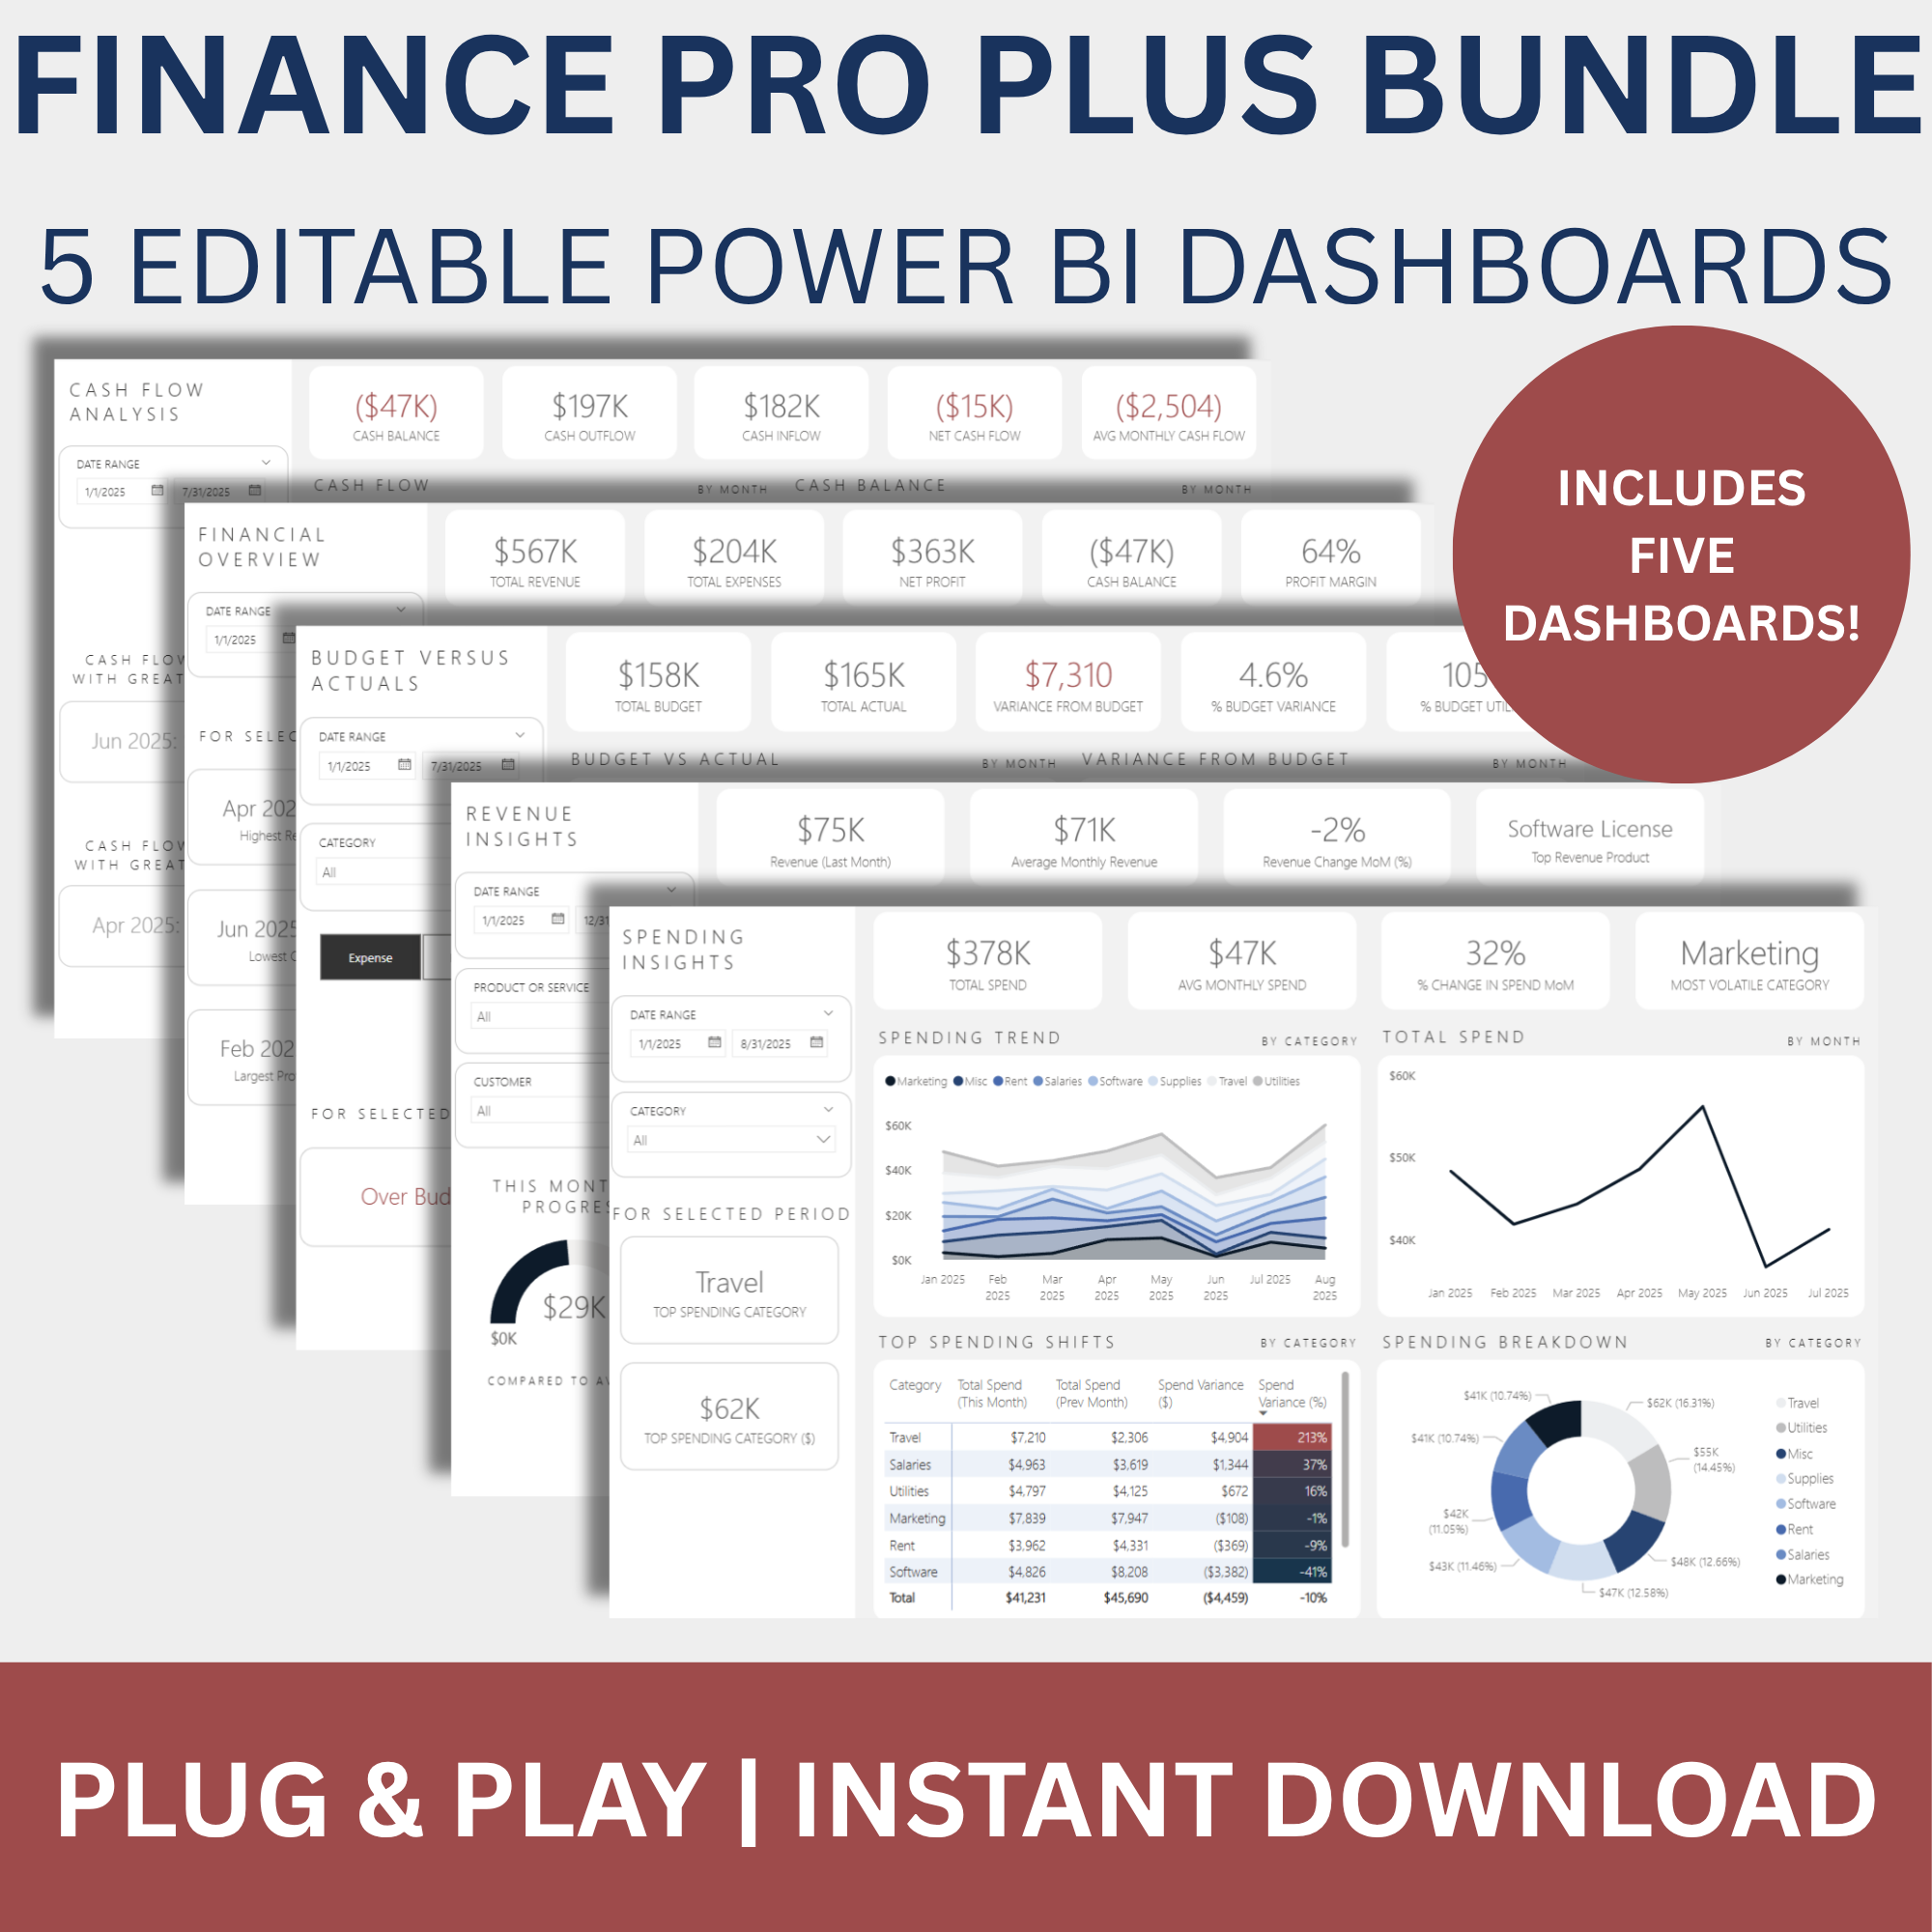
Included Dashboards:
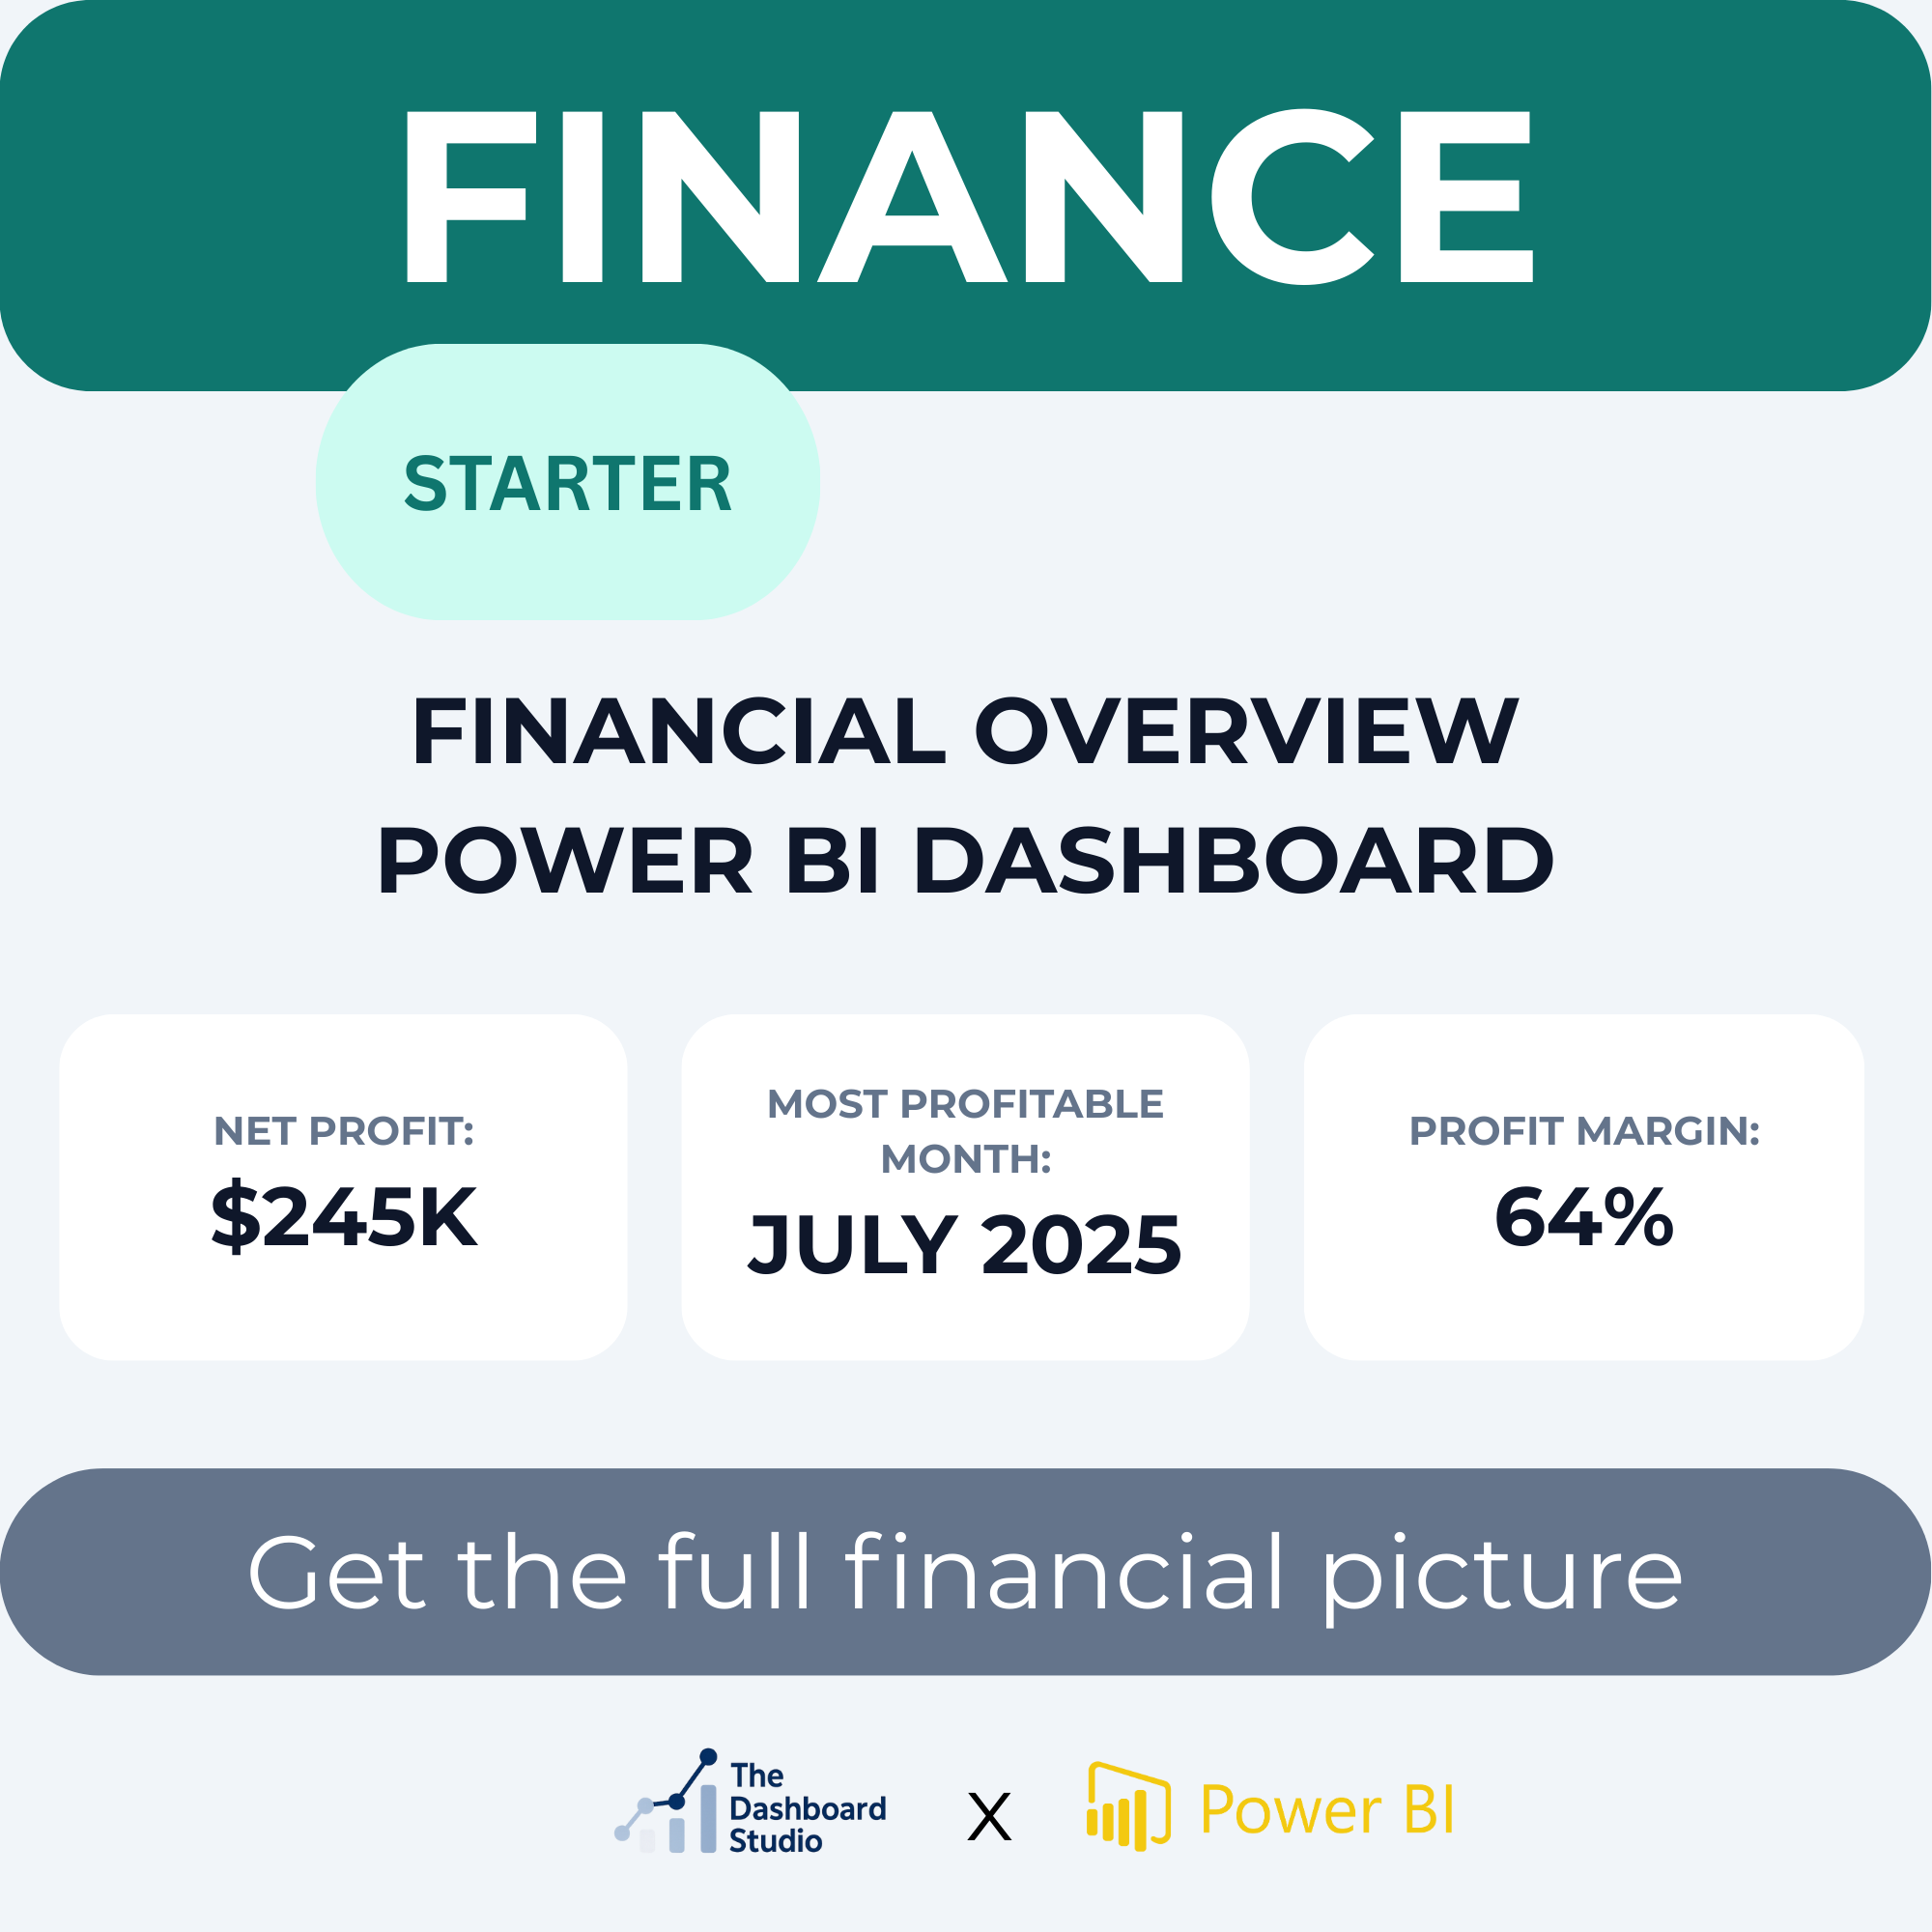
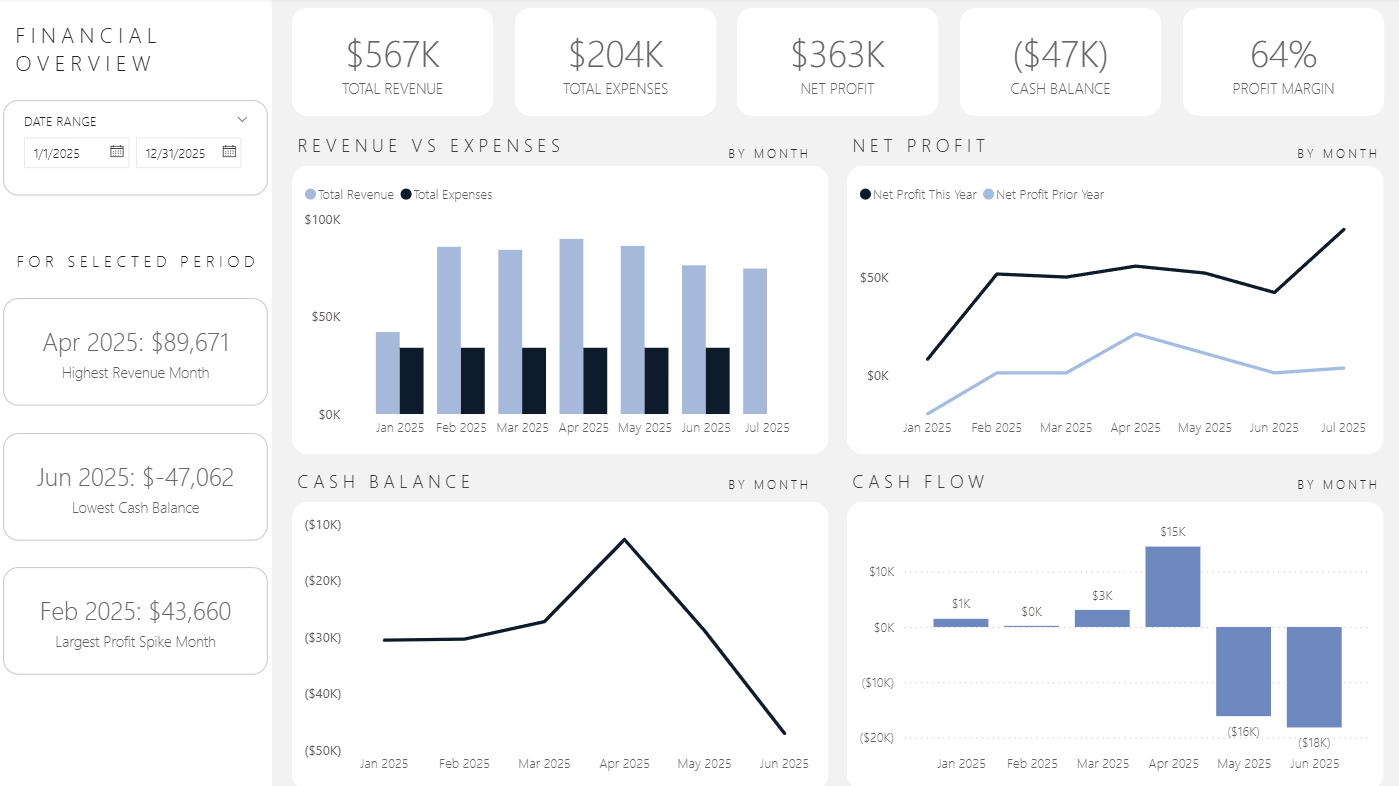
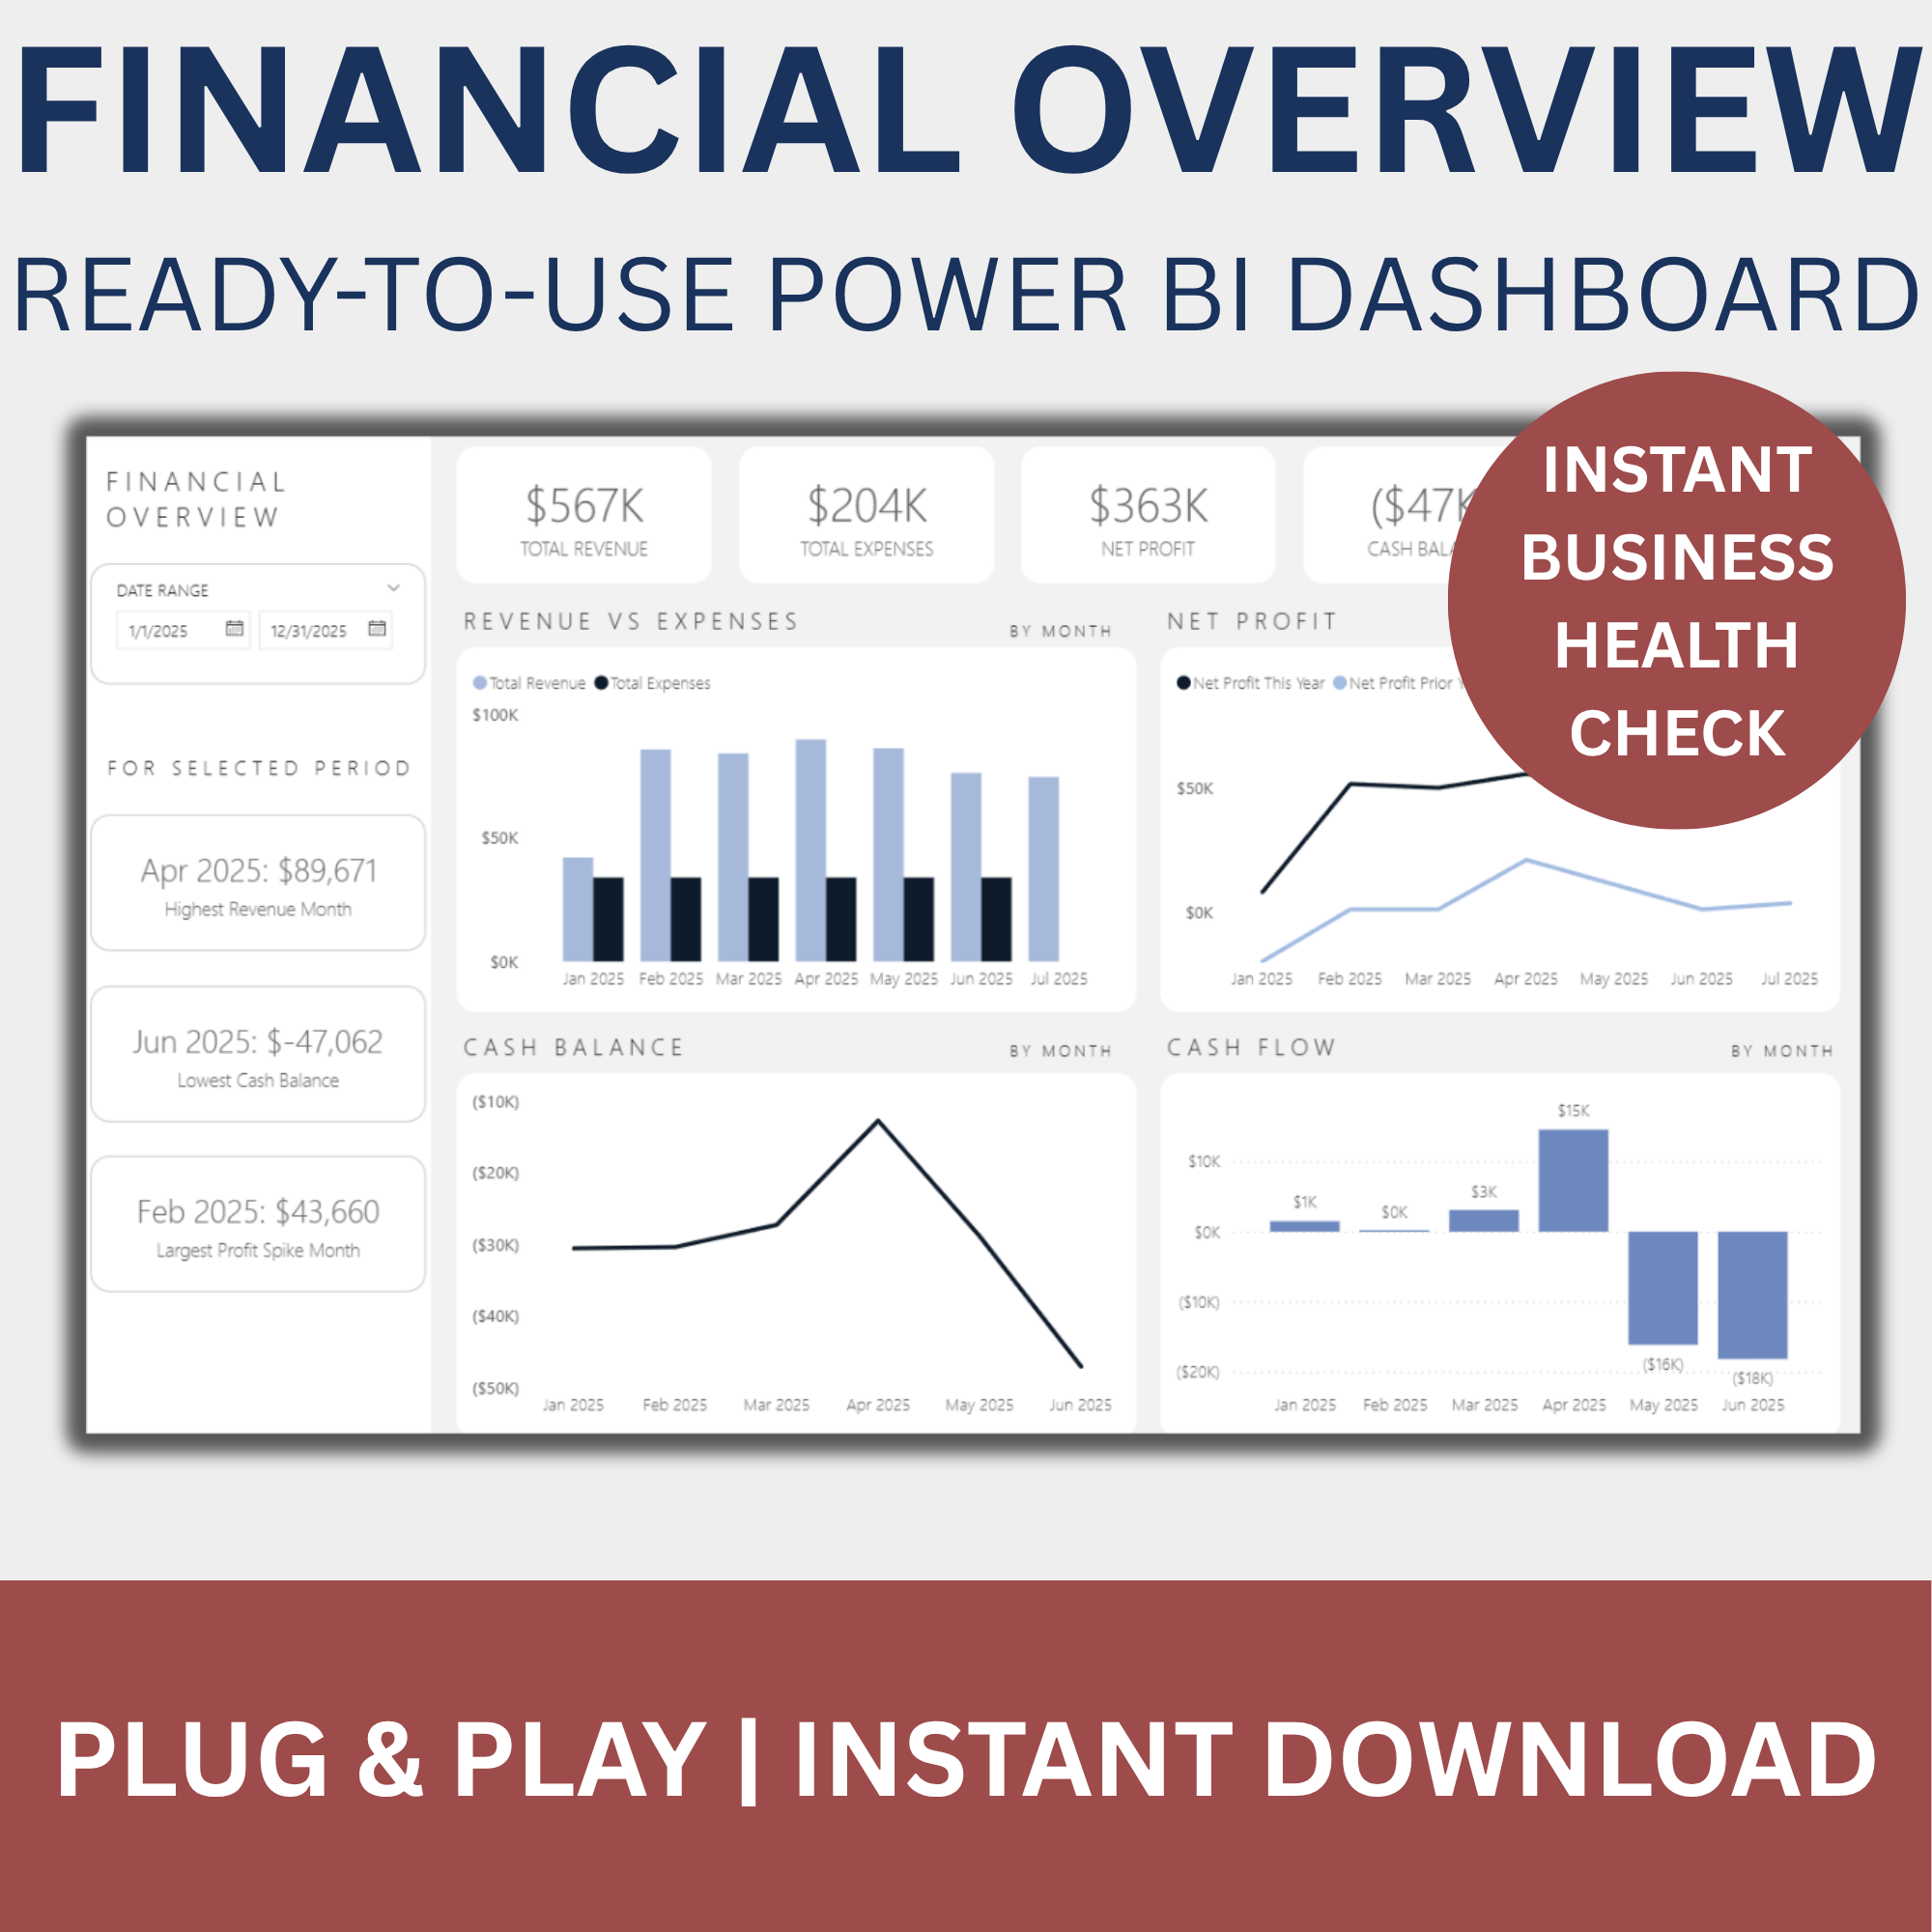
1. Financial Overview Dashboard
Track revenue, expenses, net profit, cash balance, and profit margin at a glance. Includes monthly trends and key performance callouts to help you stay on top of your bottom line.
2. Budget vs Actuals Dashboard
Compare budgeted vs. actual spend by month and category. Instantly spot overages, underutilized budgets, and high-variance categories with built-in filters and visuals.
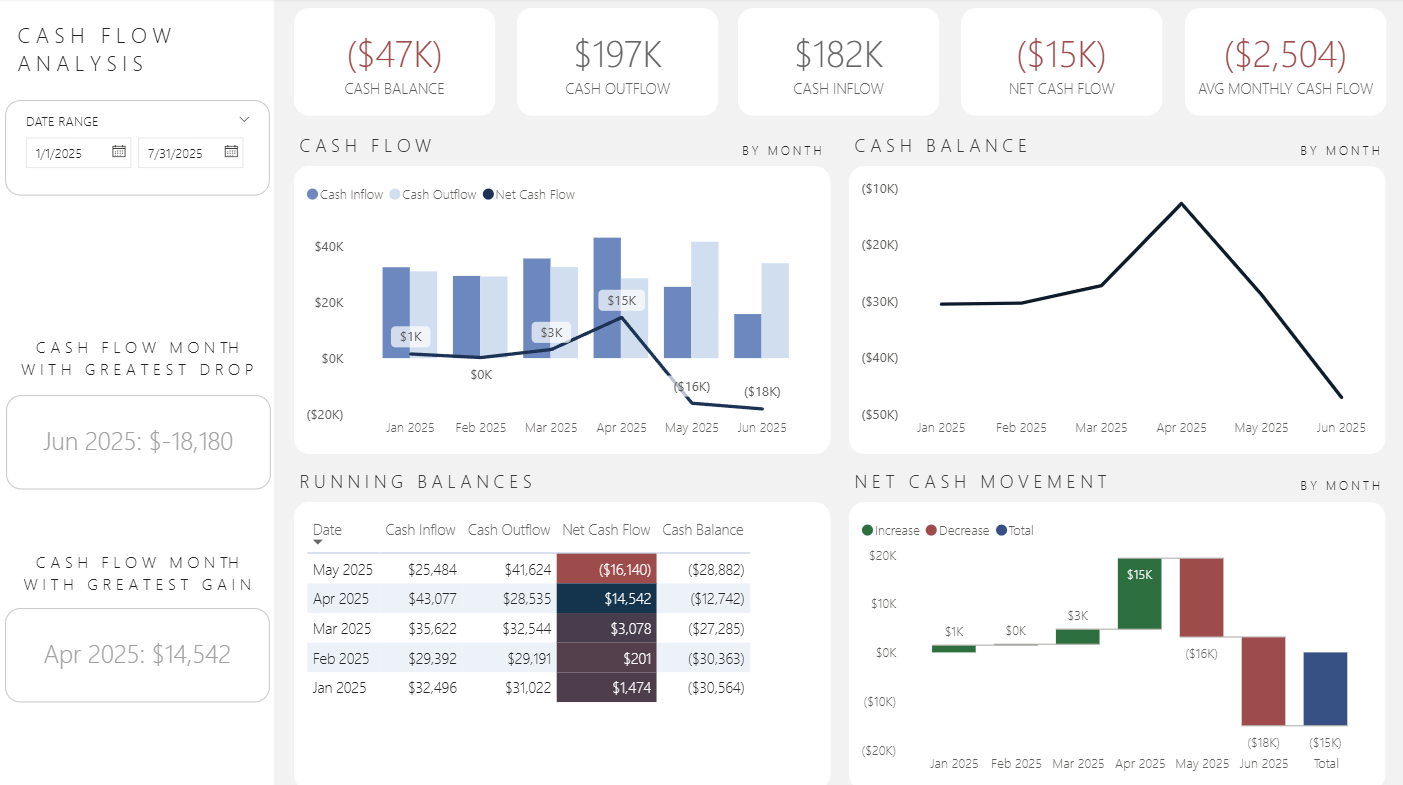
3. Cash Flow Analysis Dashboard
Monitor inflow vs. outflow, track monthly net cash movement, and visualize your running cash balance over time. Includes insights into biggest gains/drops and average cash flow.
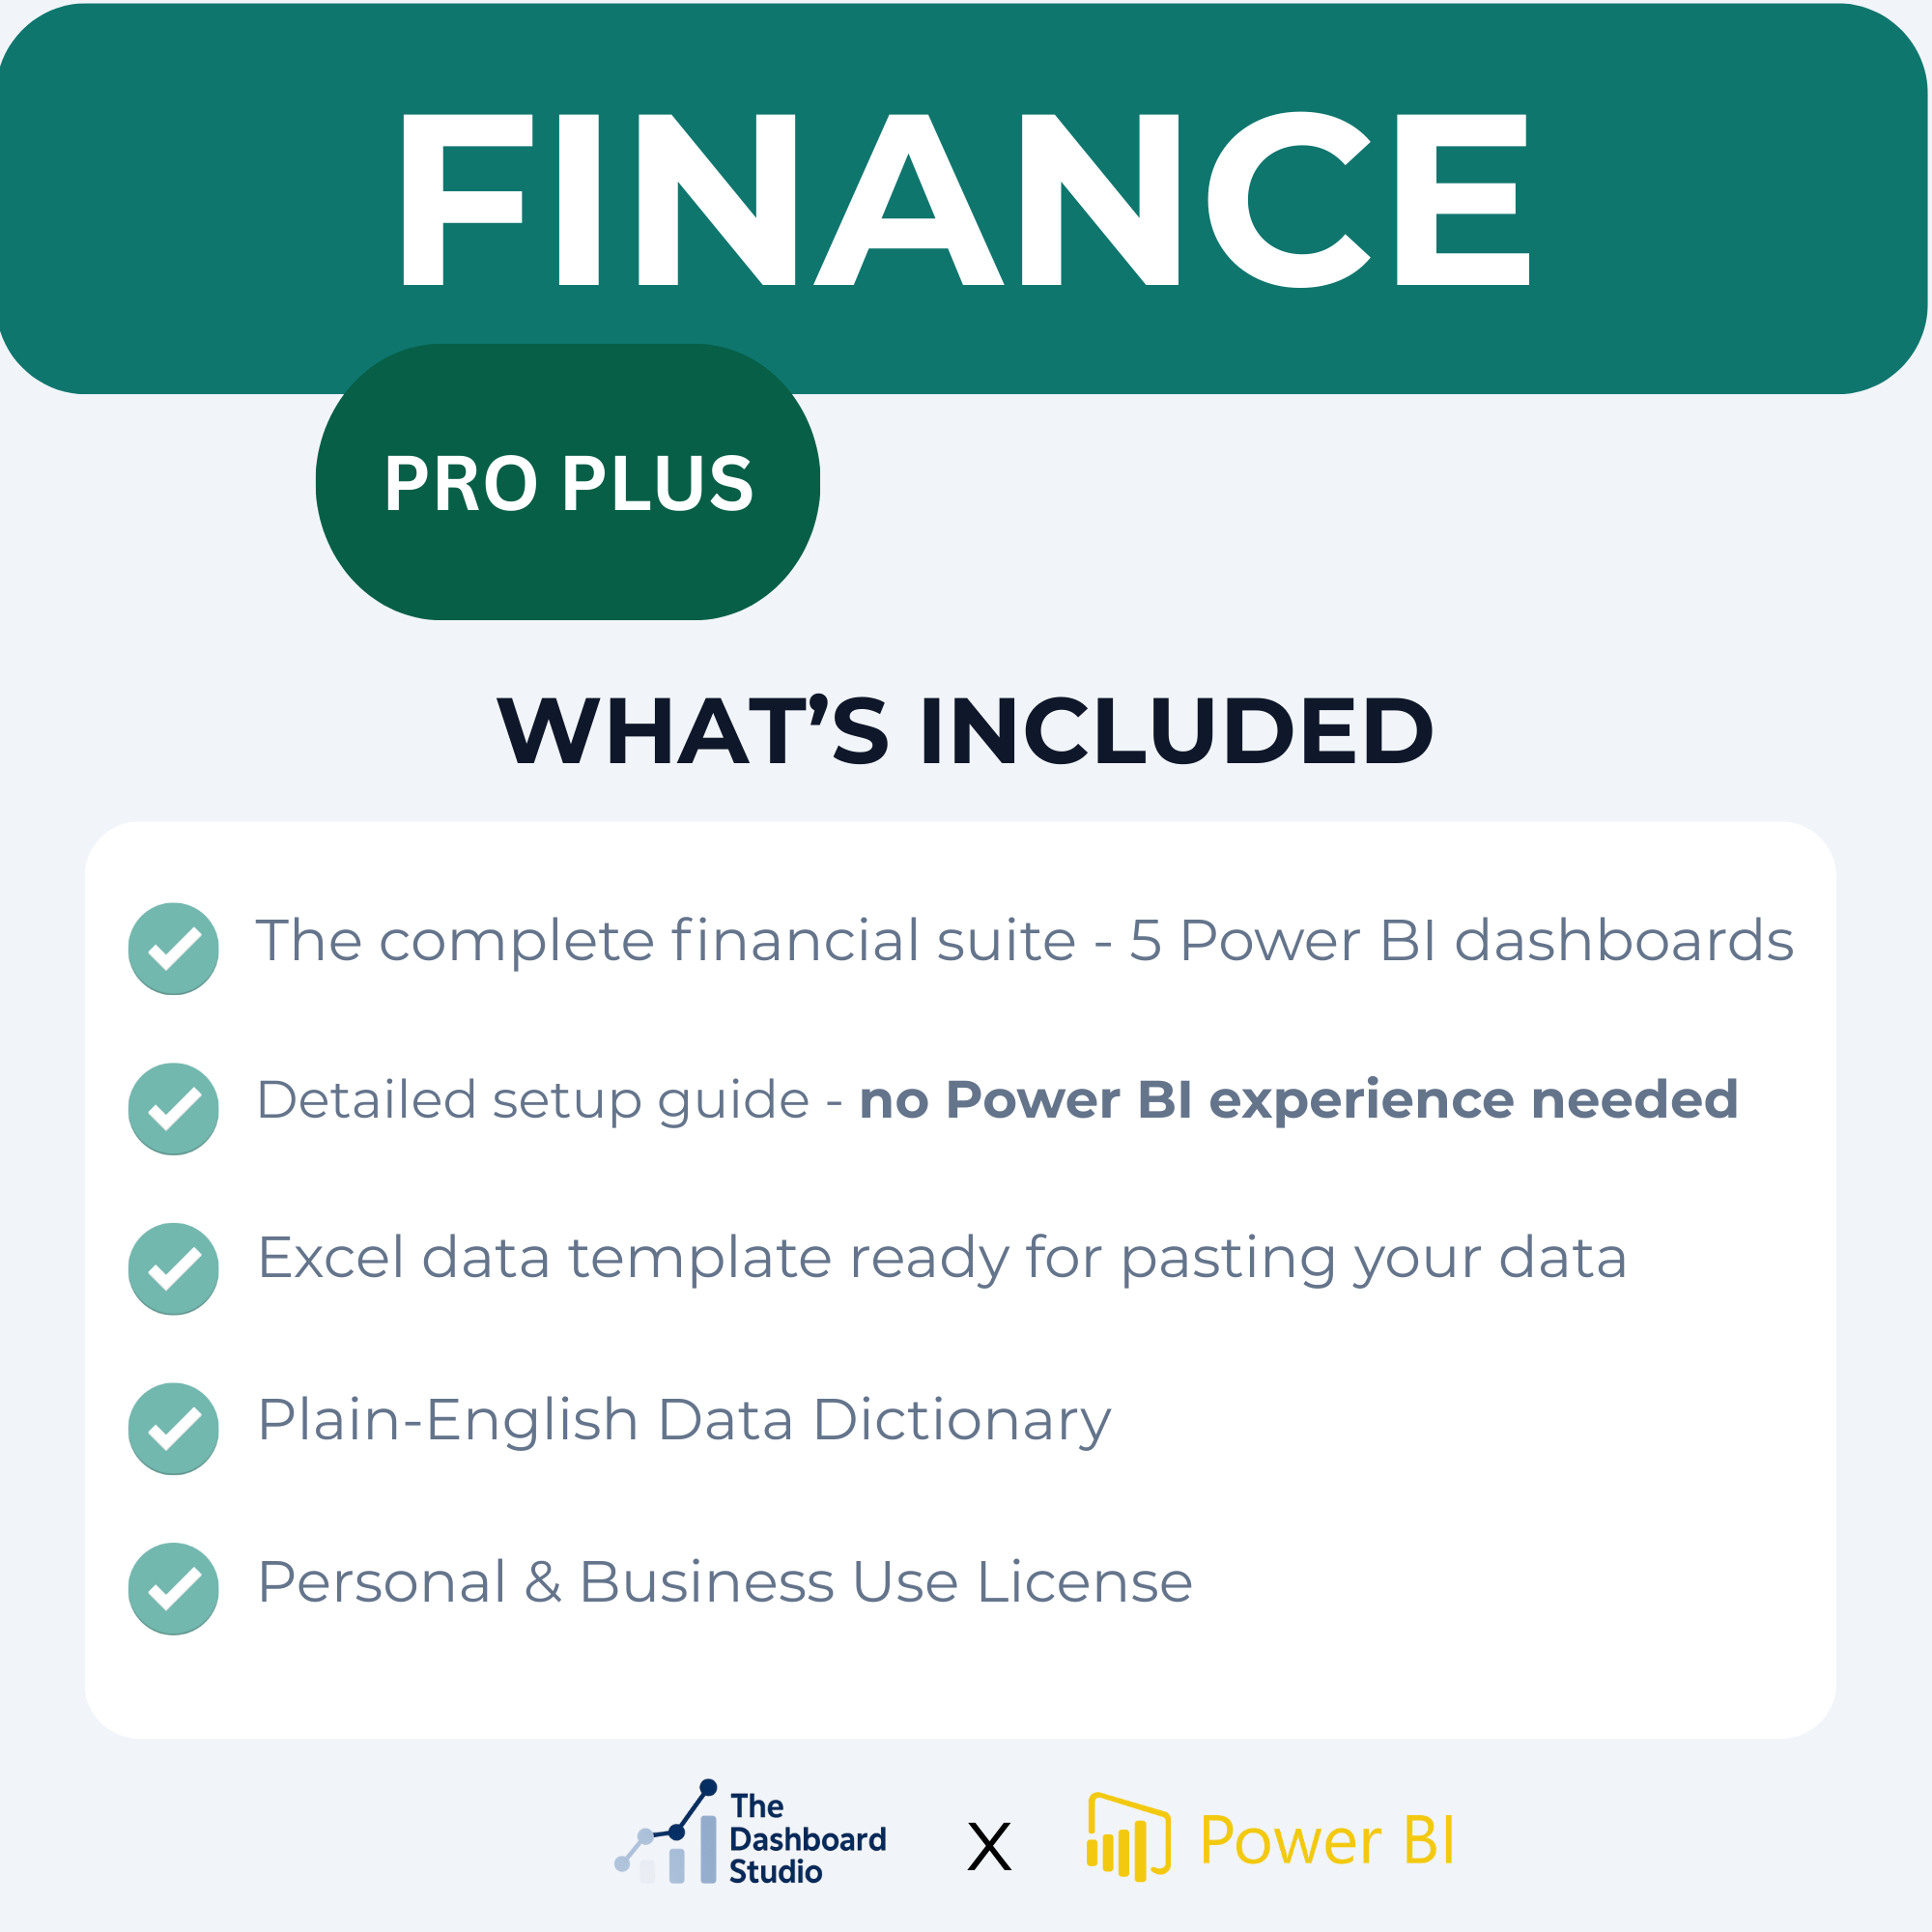
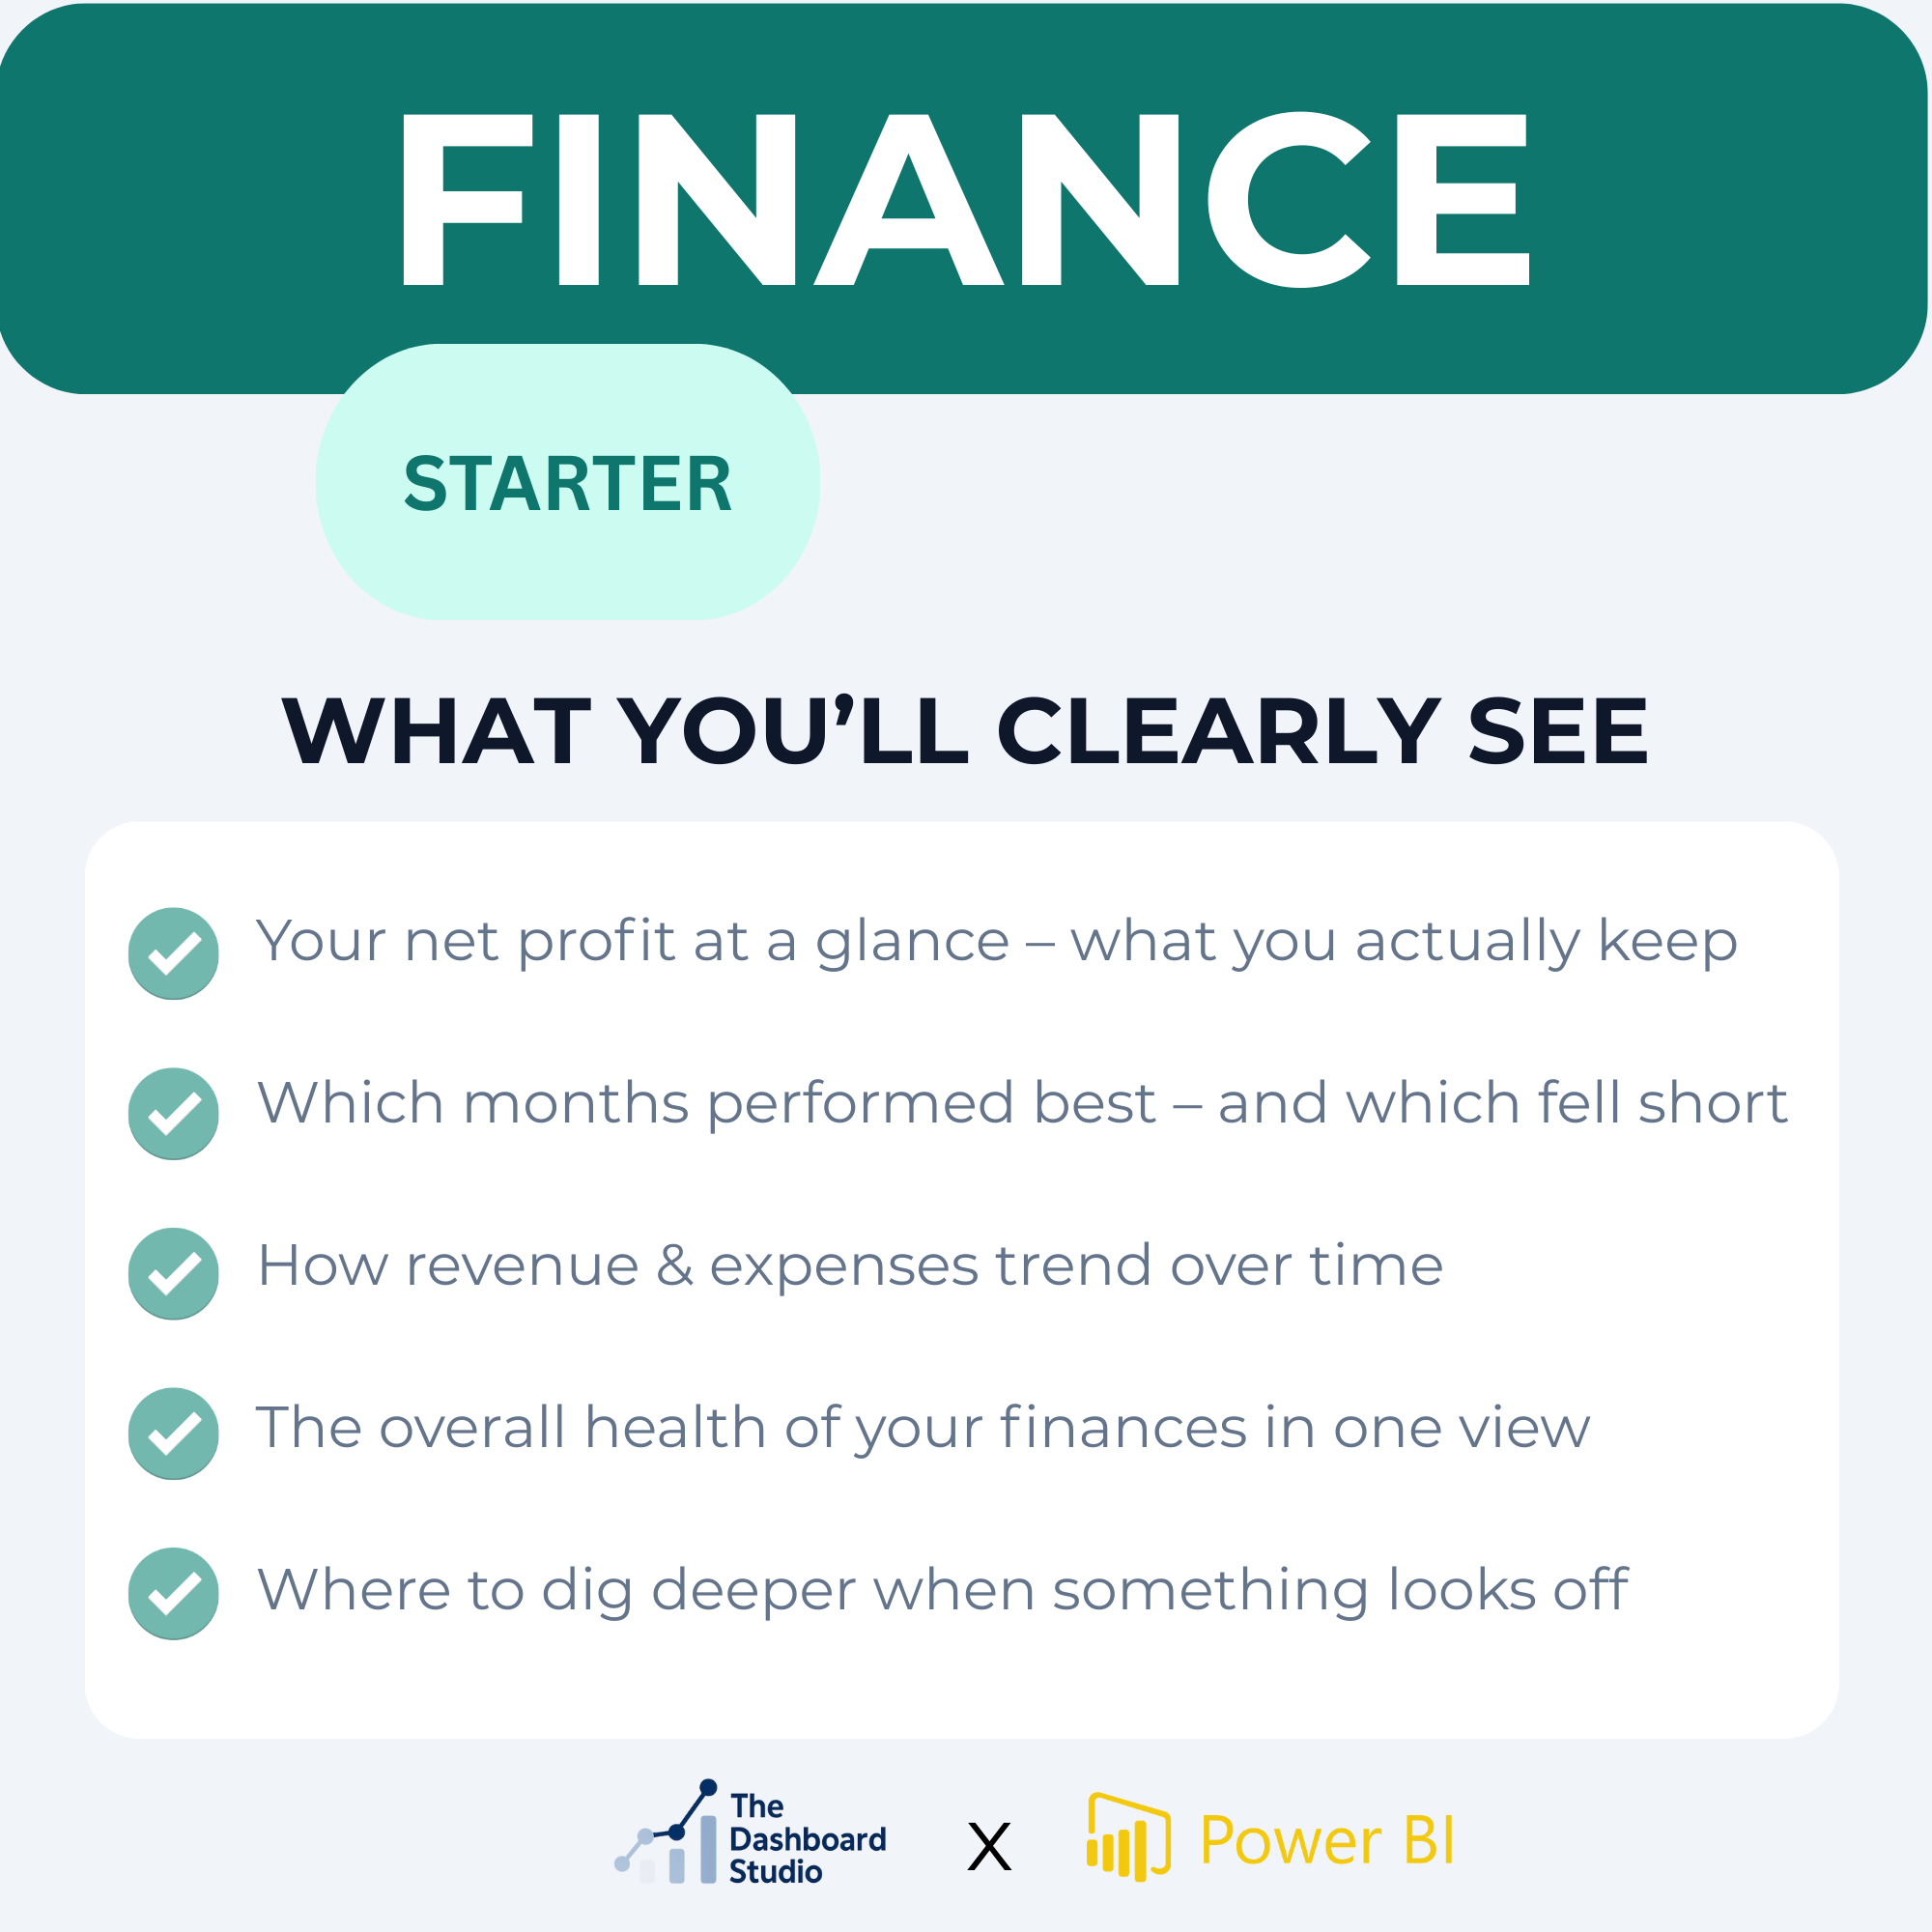
What You Get:
Simplify your financial reporting today with this powerful 3-dashboard bundle — no advanced Power BI skills required.
Get full visibility into your business finances with this Finance Dashboard Bundle — a collection of three executive-ready Power BI templates designed to track spending, measure profitability, and monitor cash flow with ease.
Whether you're a small business owner, finance manager, or consultant, this bundle equips you with the tools to make confident, data-driven decisions without digging through spreadsheets.
Instant Digital Download — Your dashboards will be delivered to your email immediately after checkout. No waiting, no shipping.
Included Dashboards:
1. Financial Overview Dashboard
Track revenue, expenses, net profit, cash balance, and profit margin at a glance. Includes monthly trends and key performance callouts to help you stay on top of your bottom line.
2. Budget vs Actuals Dashboard
Compare budgeted vs. actual spend by month and category. Instantly spot overages, underutilized budgets, and high-variance categories with built-in filters and visuals.
3. Cash Flow Analysis Dashboard
Monitor inflow vs. outflow, track monthly net cash movement, and visualize your running cash balance over time. Includes insights into biggest gains/drops and average cash flow.
What You Get:
Simplify your financial reporting today with this powerful 3-dashboard bundle — no advanced Power BI skills required.

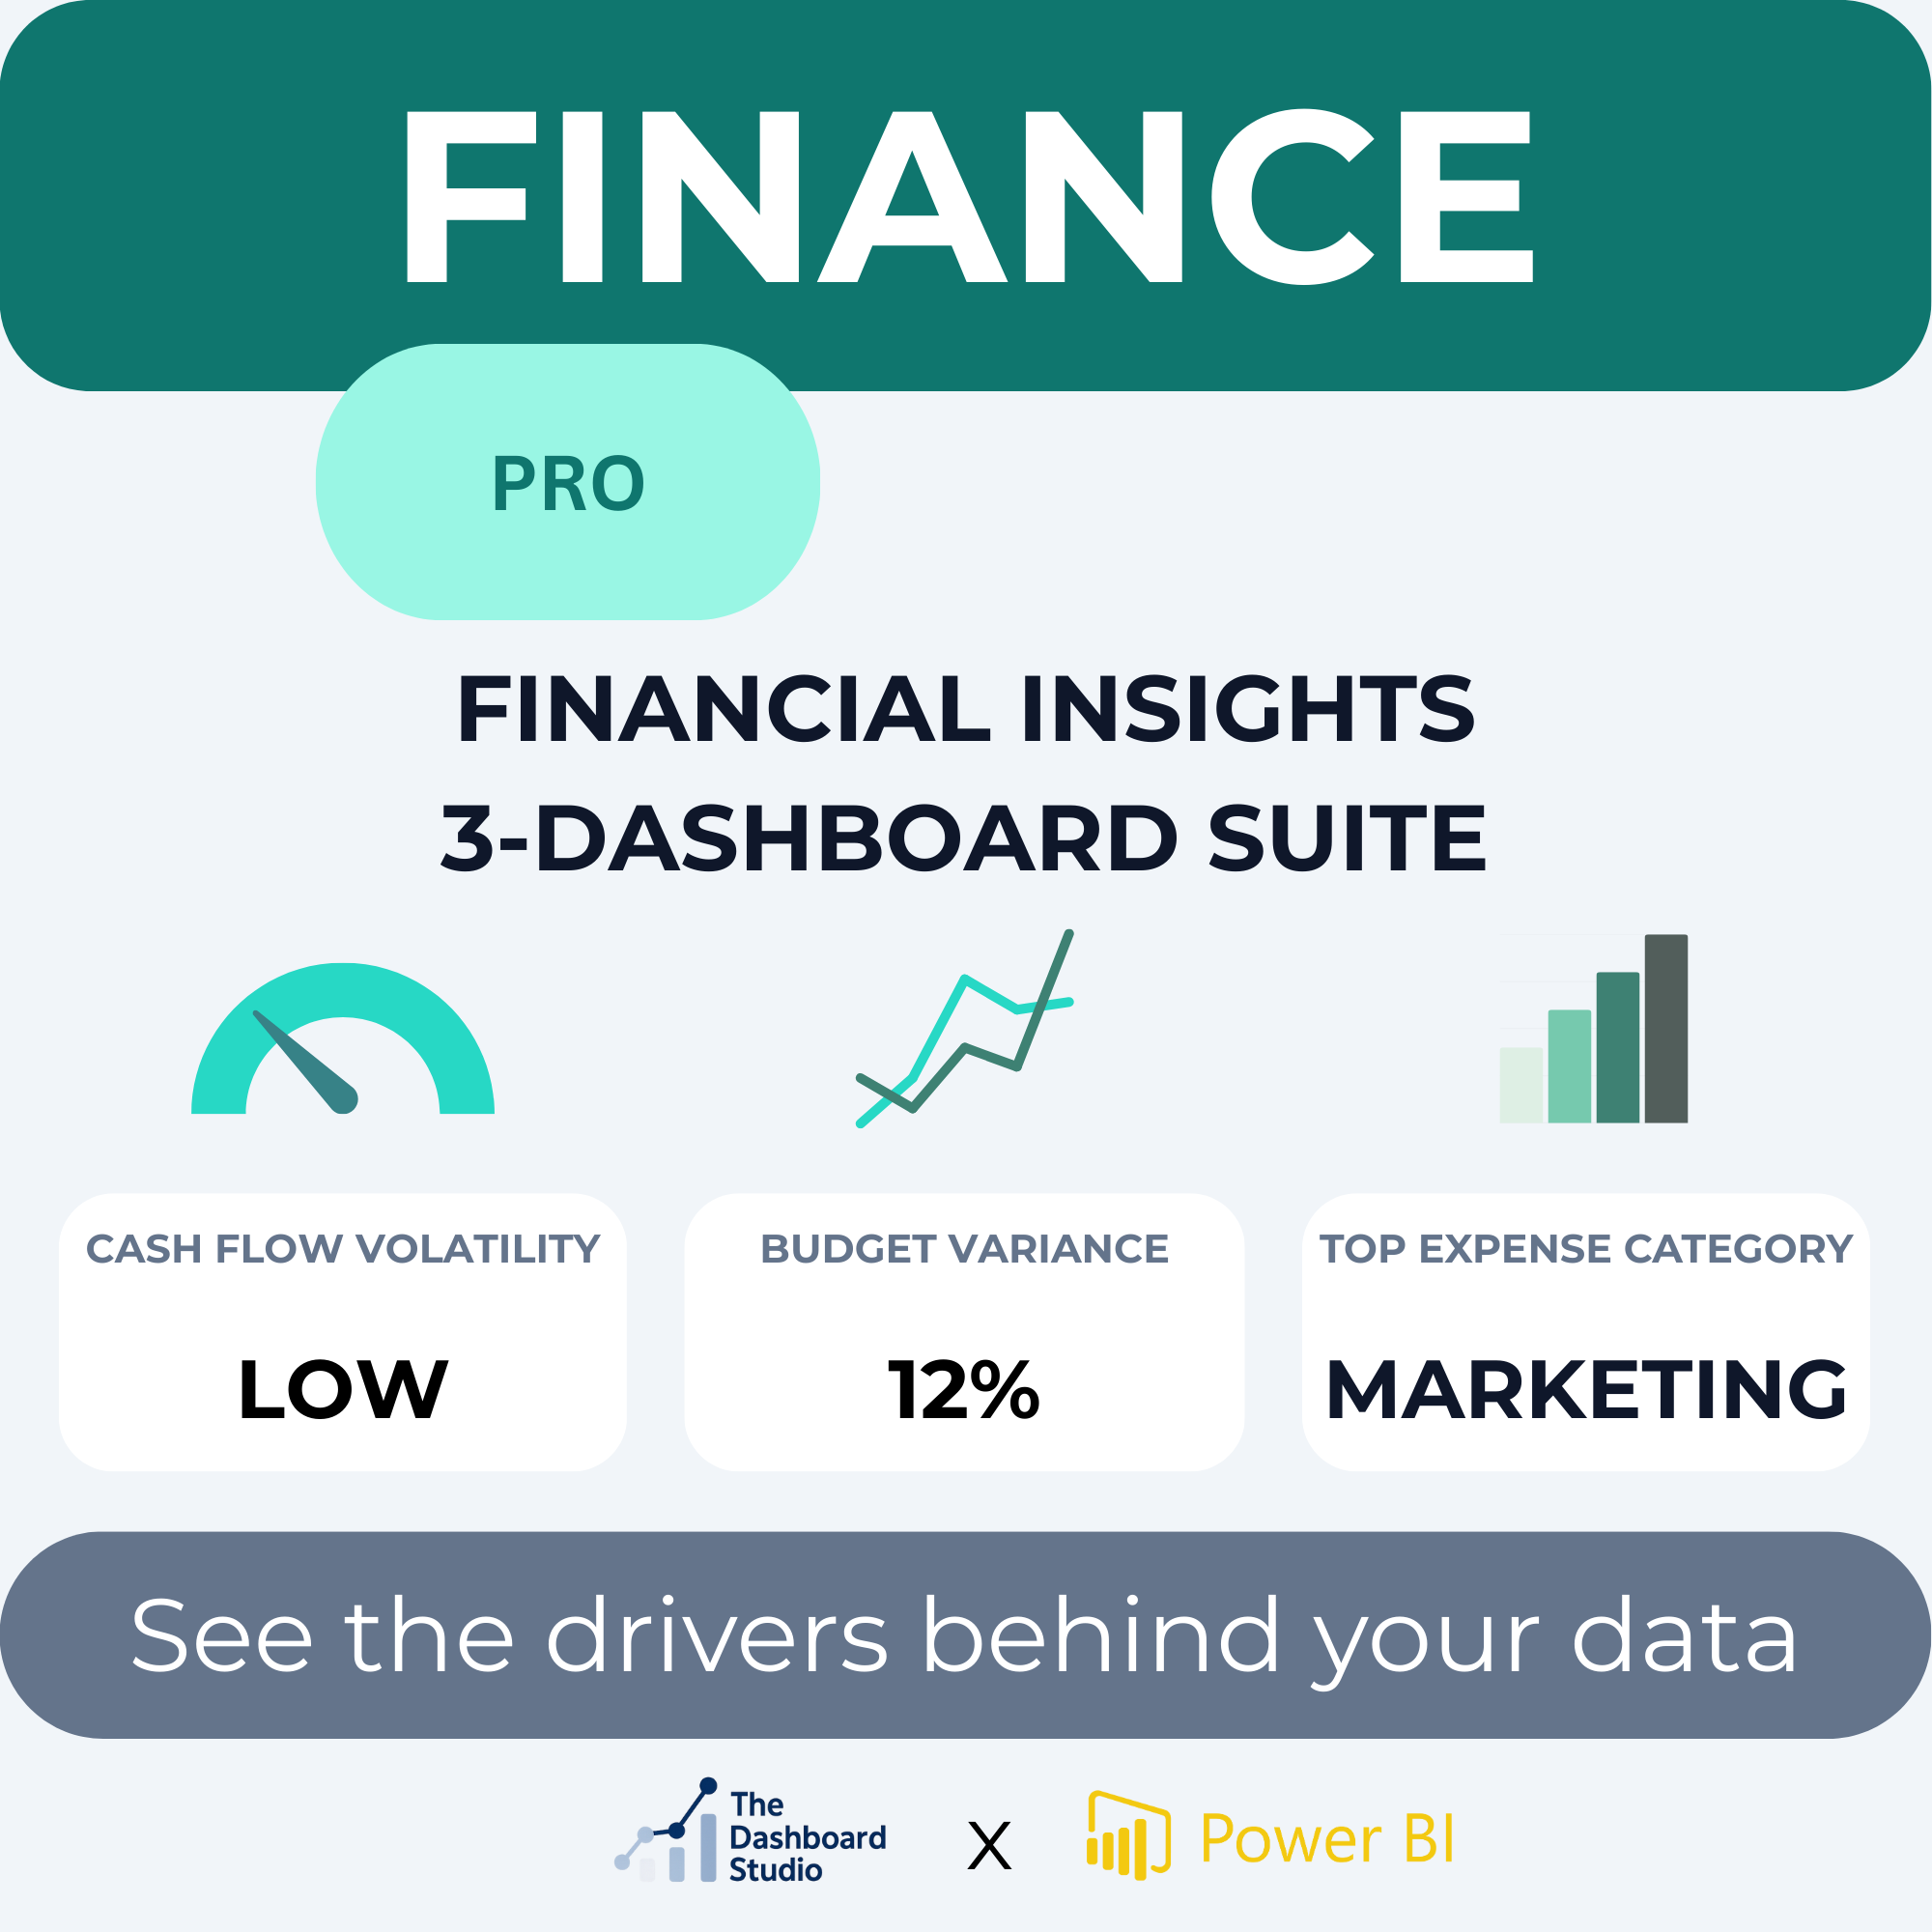 Image 1 of 7
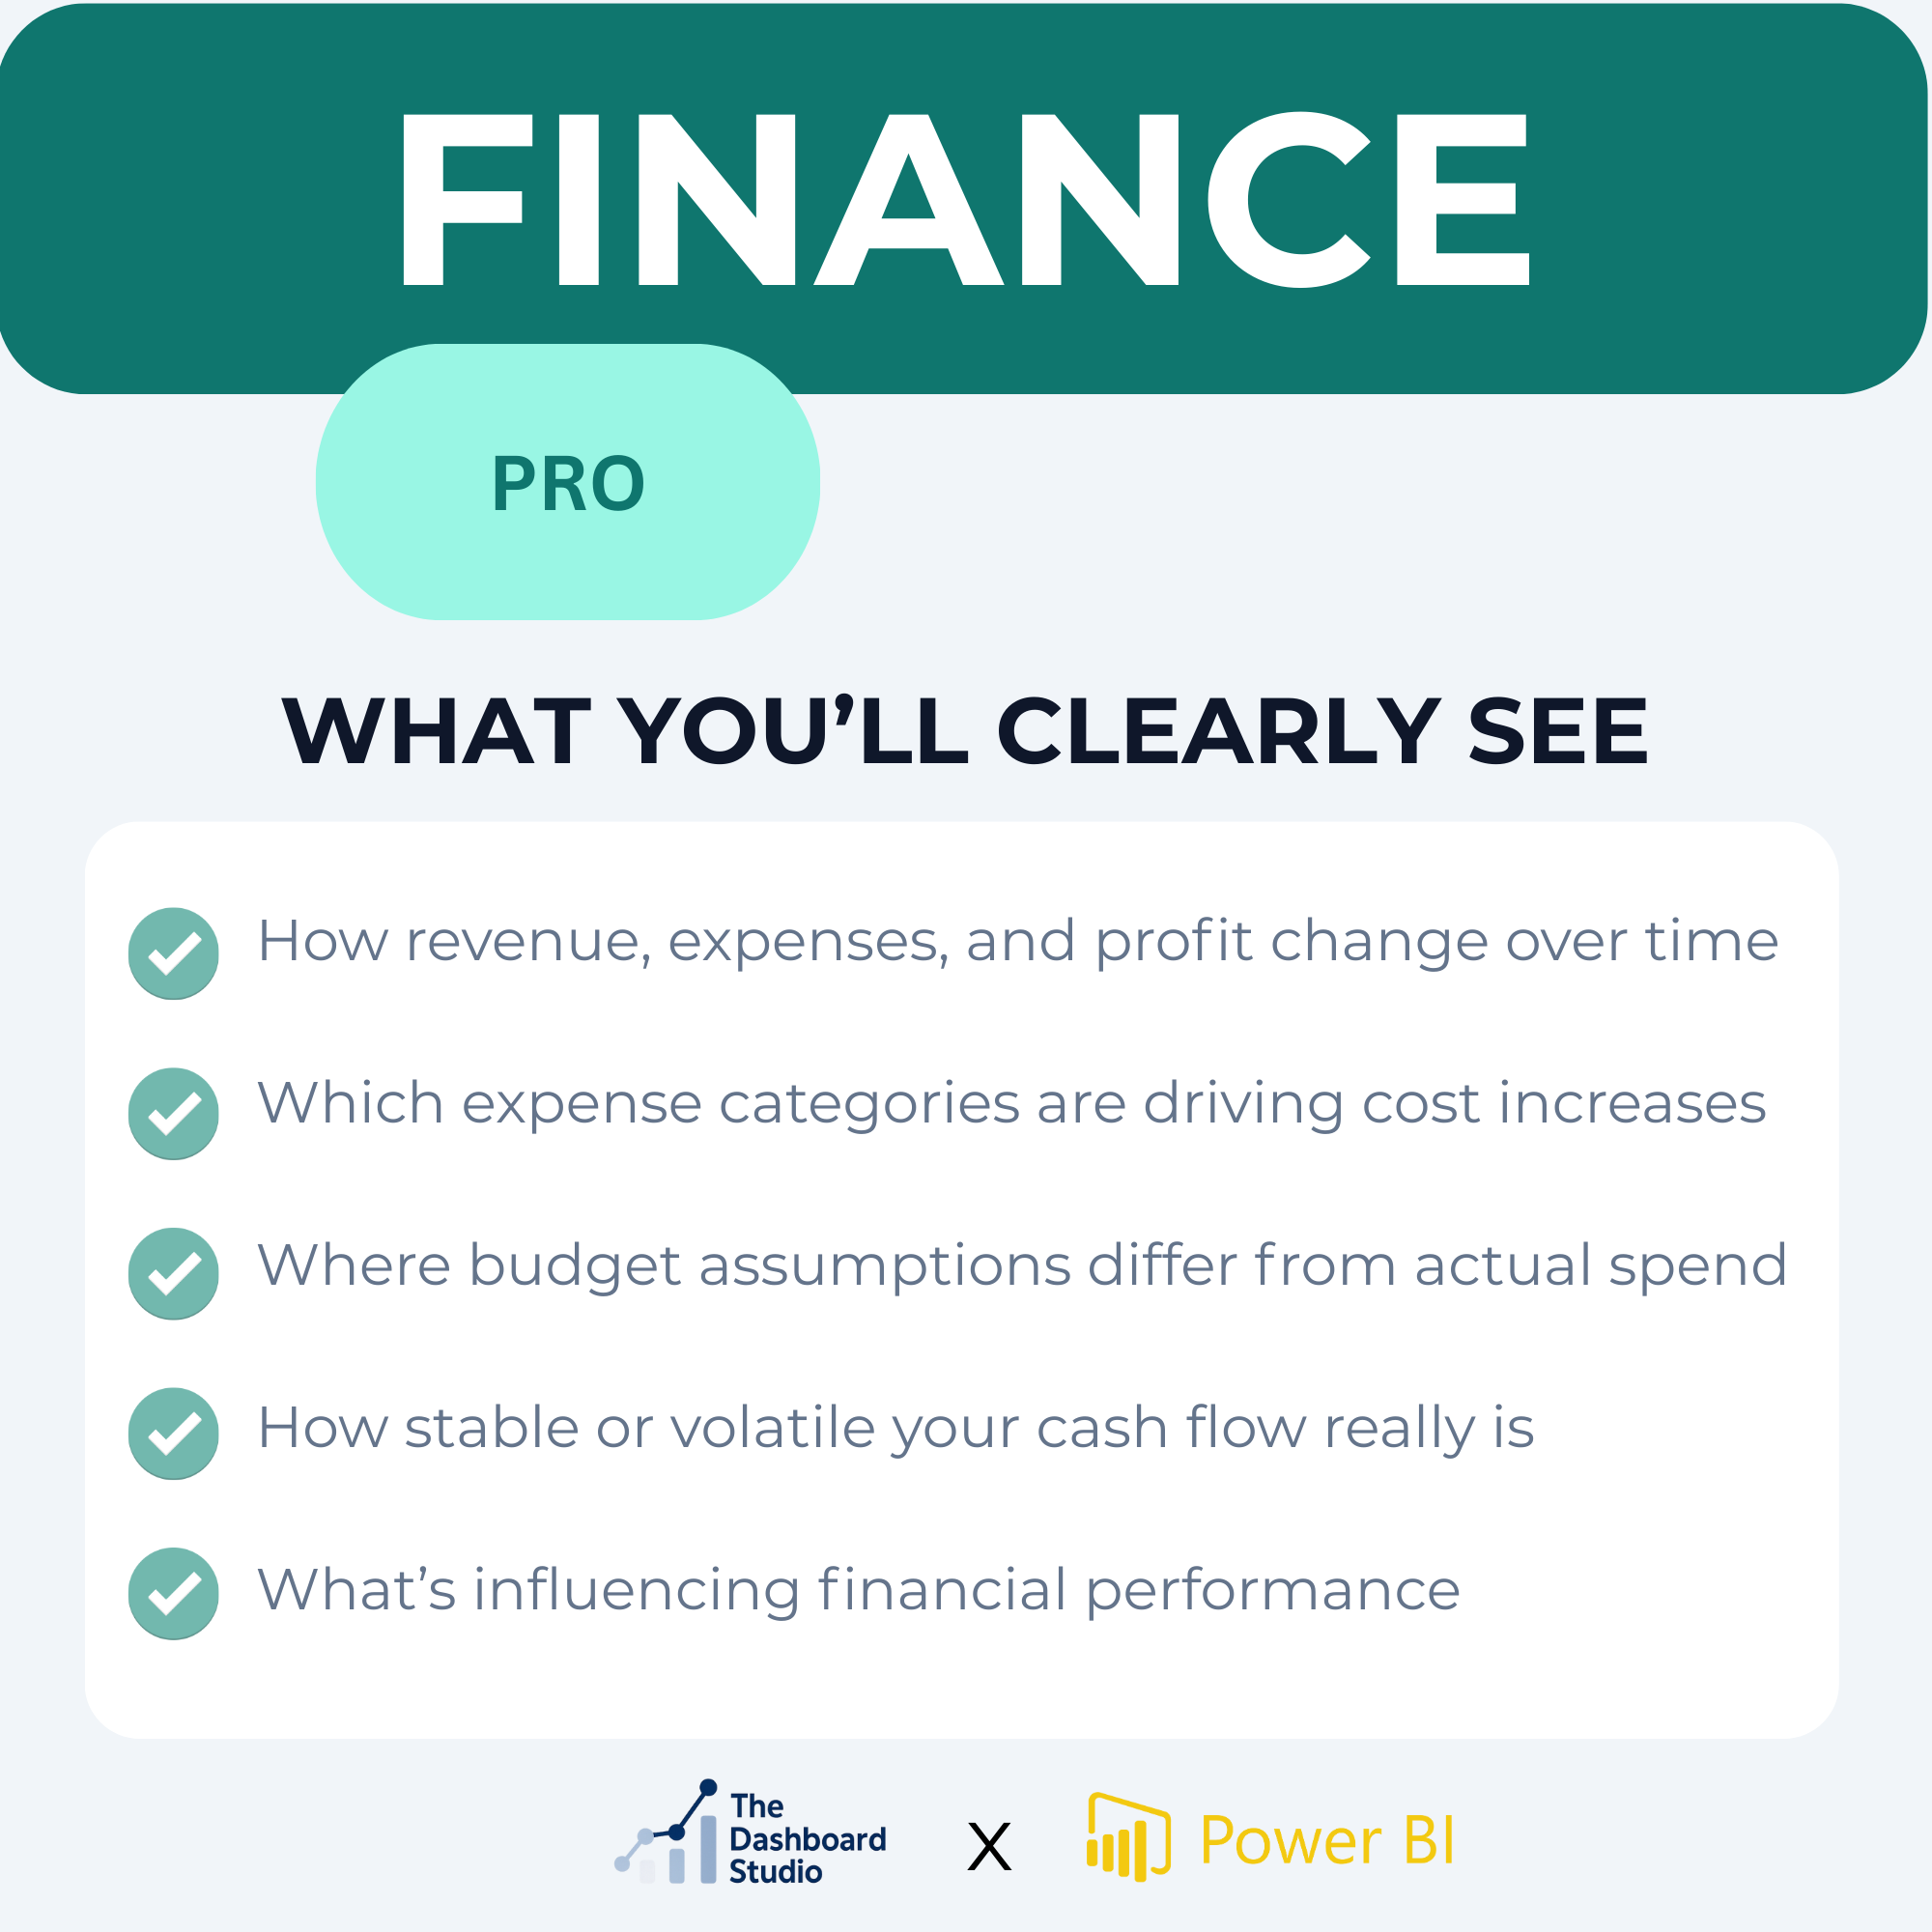 Image 2 of 7
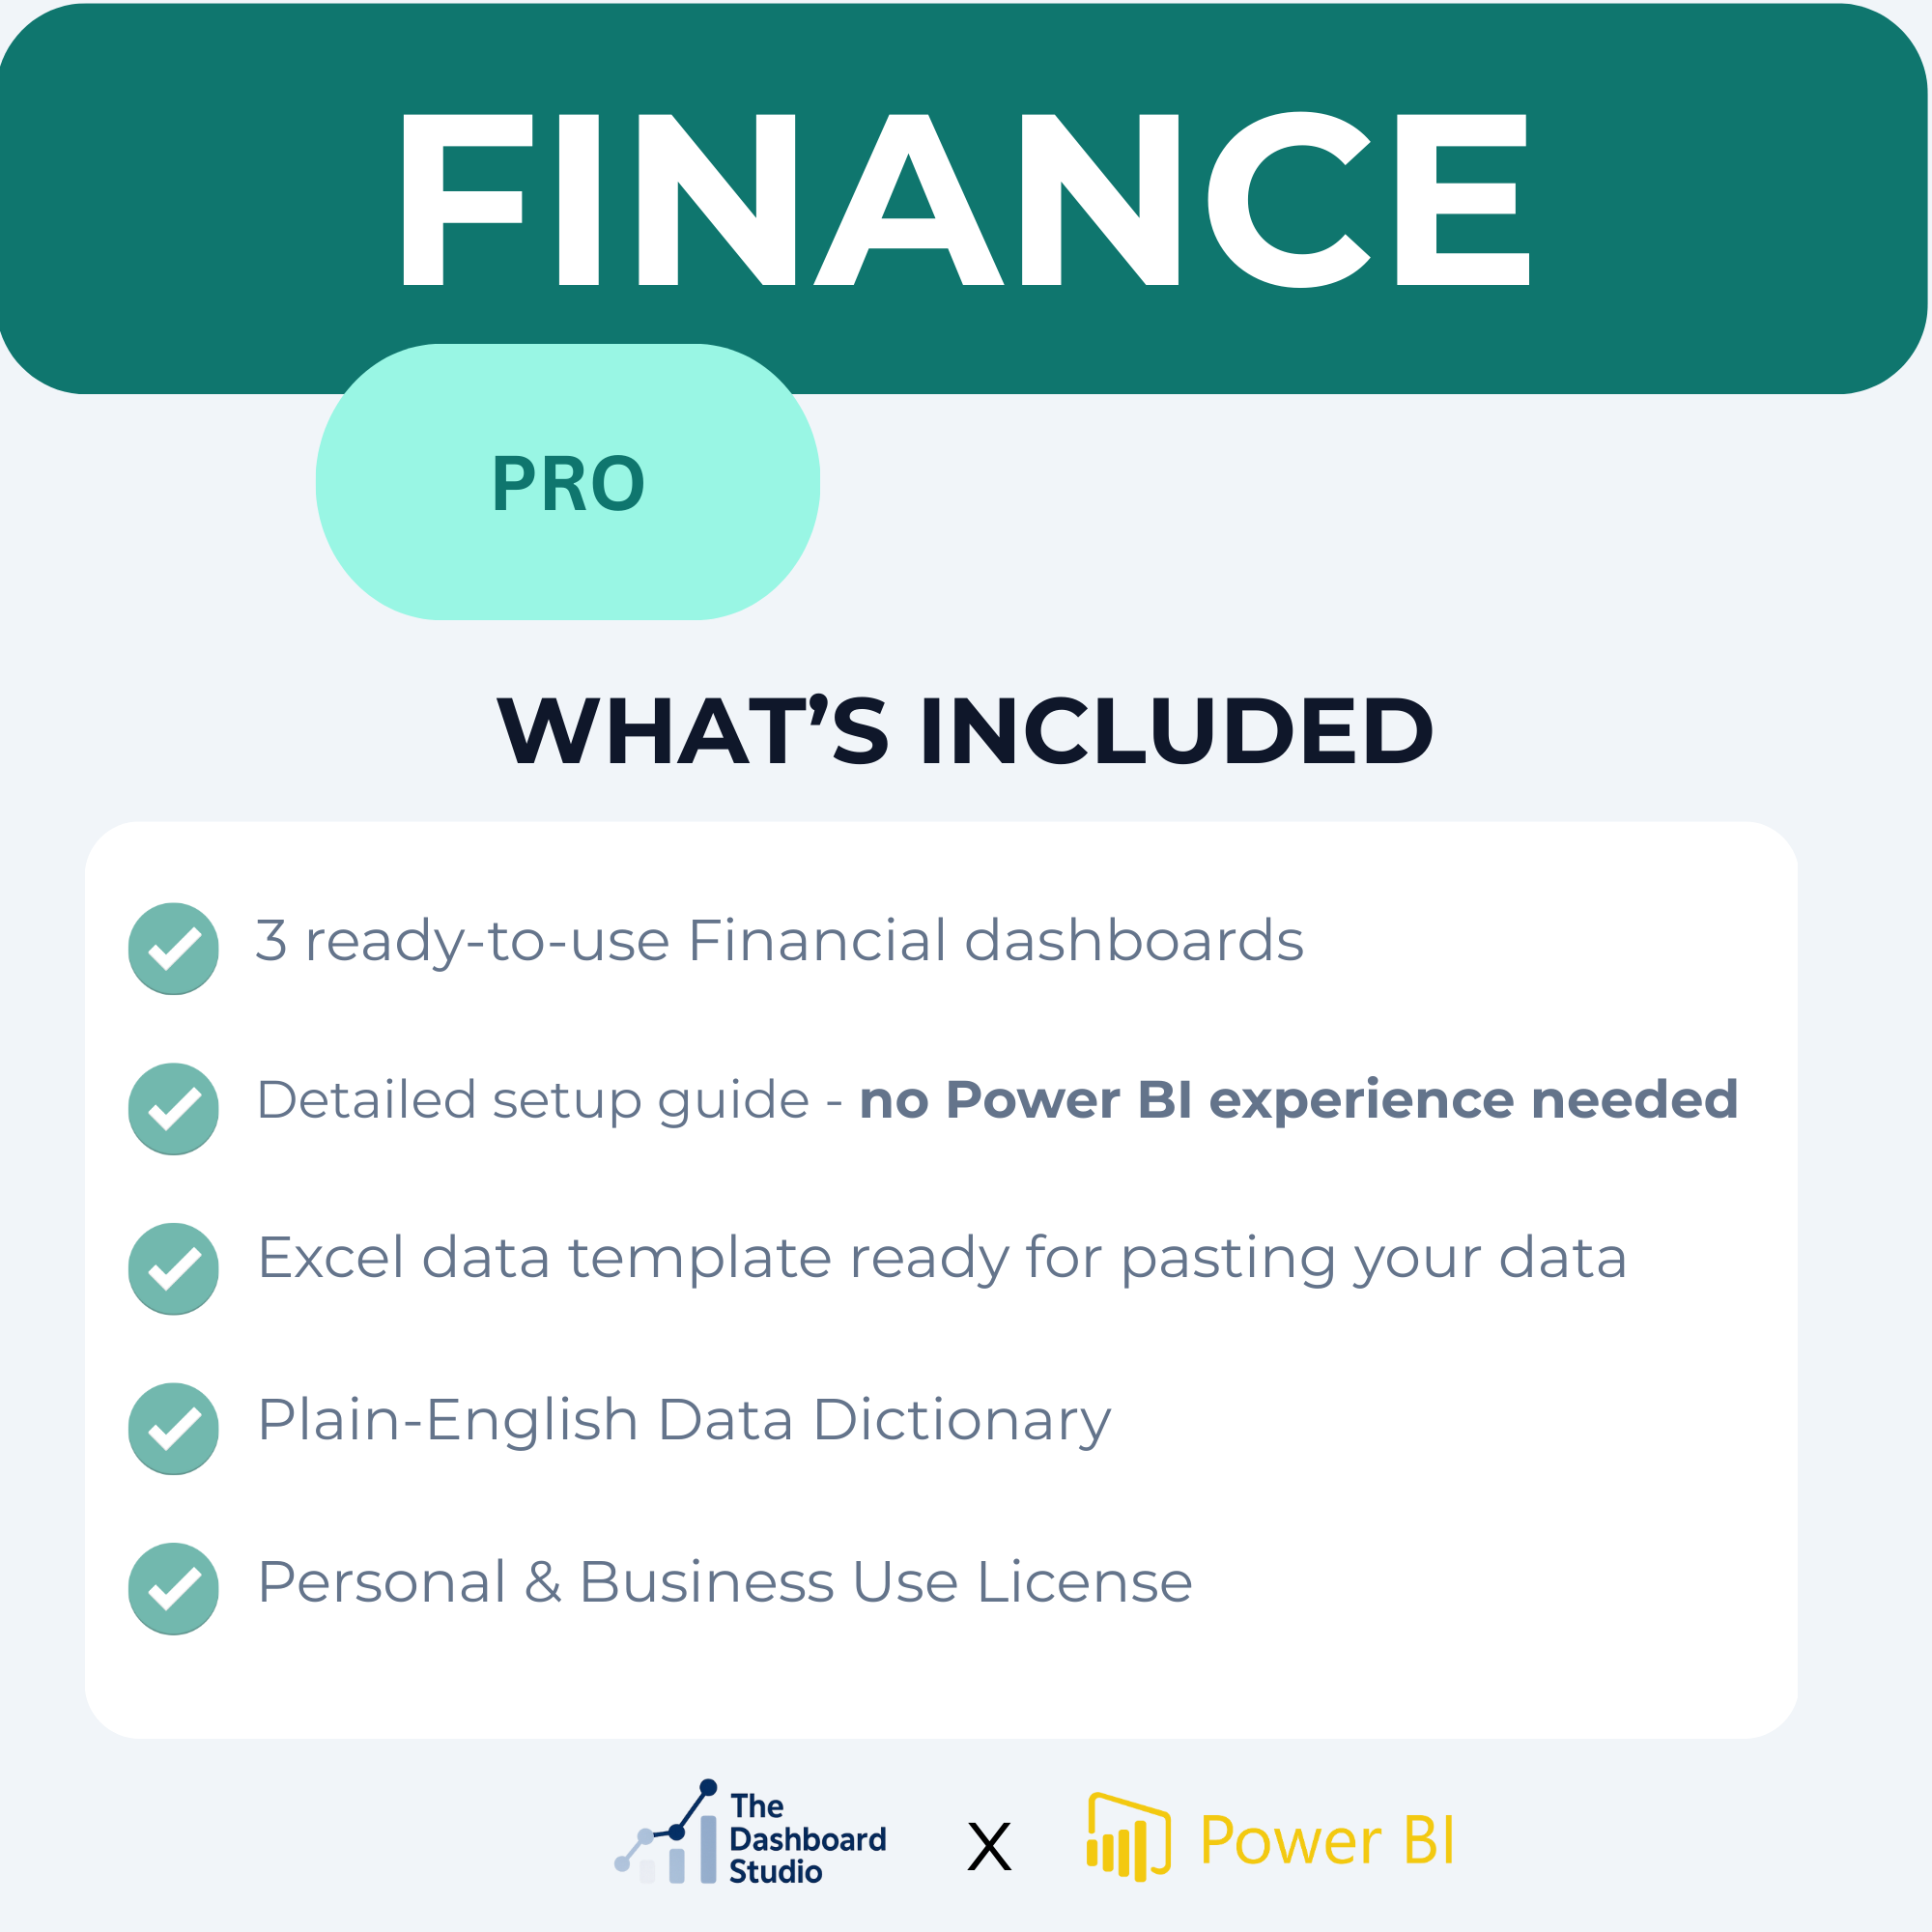 Image 3 of 7
 Image 4 of 7
 Image 5 of 7
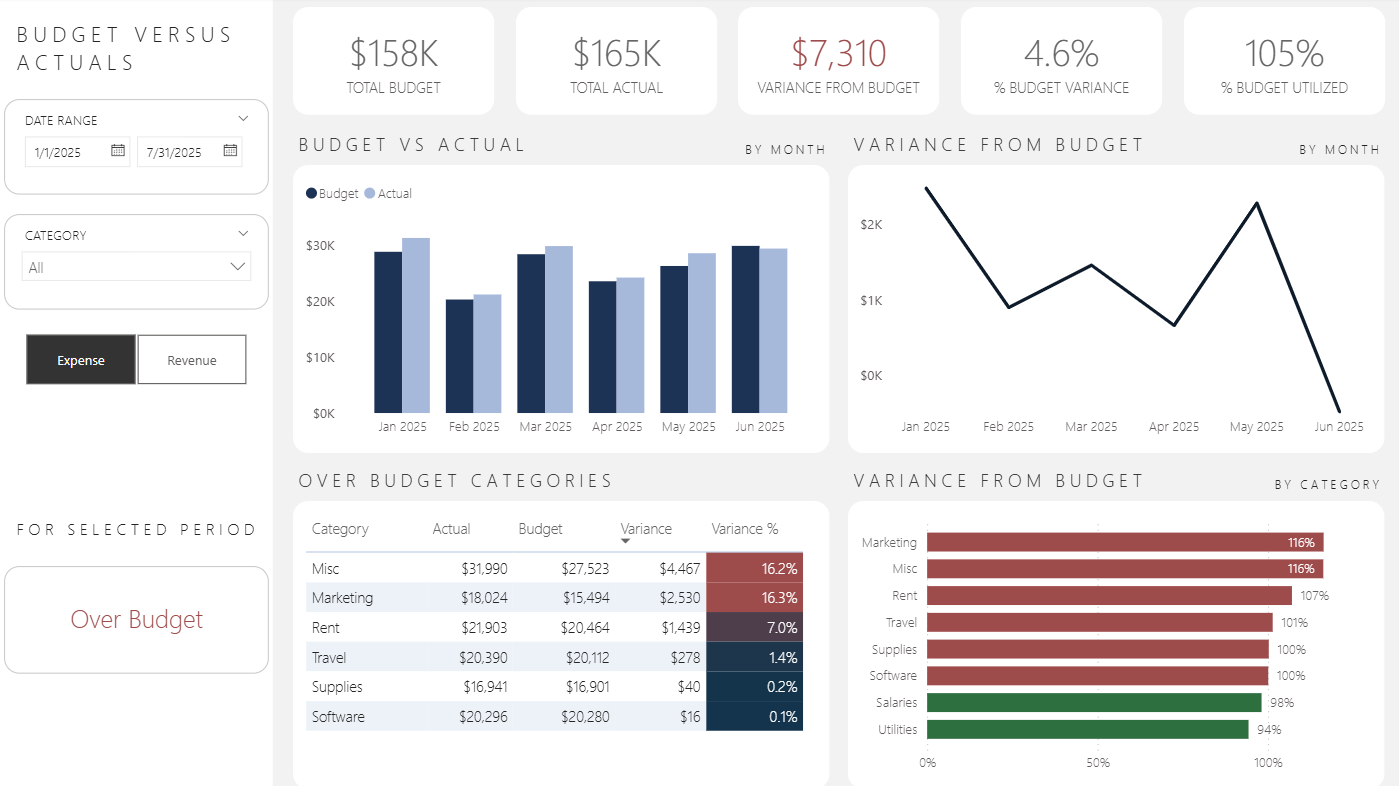 Image 6 of 7
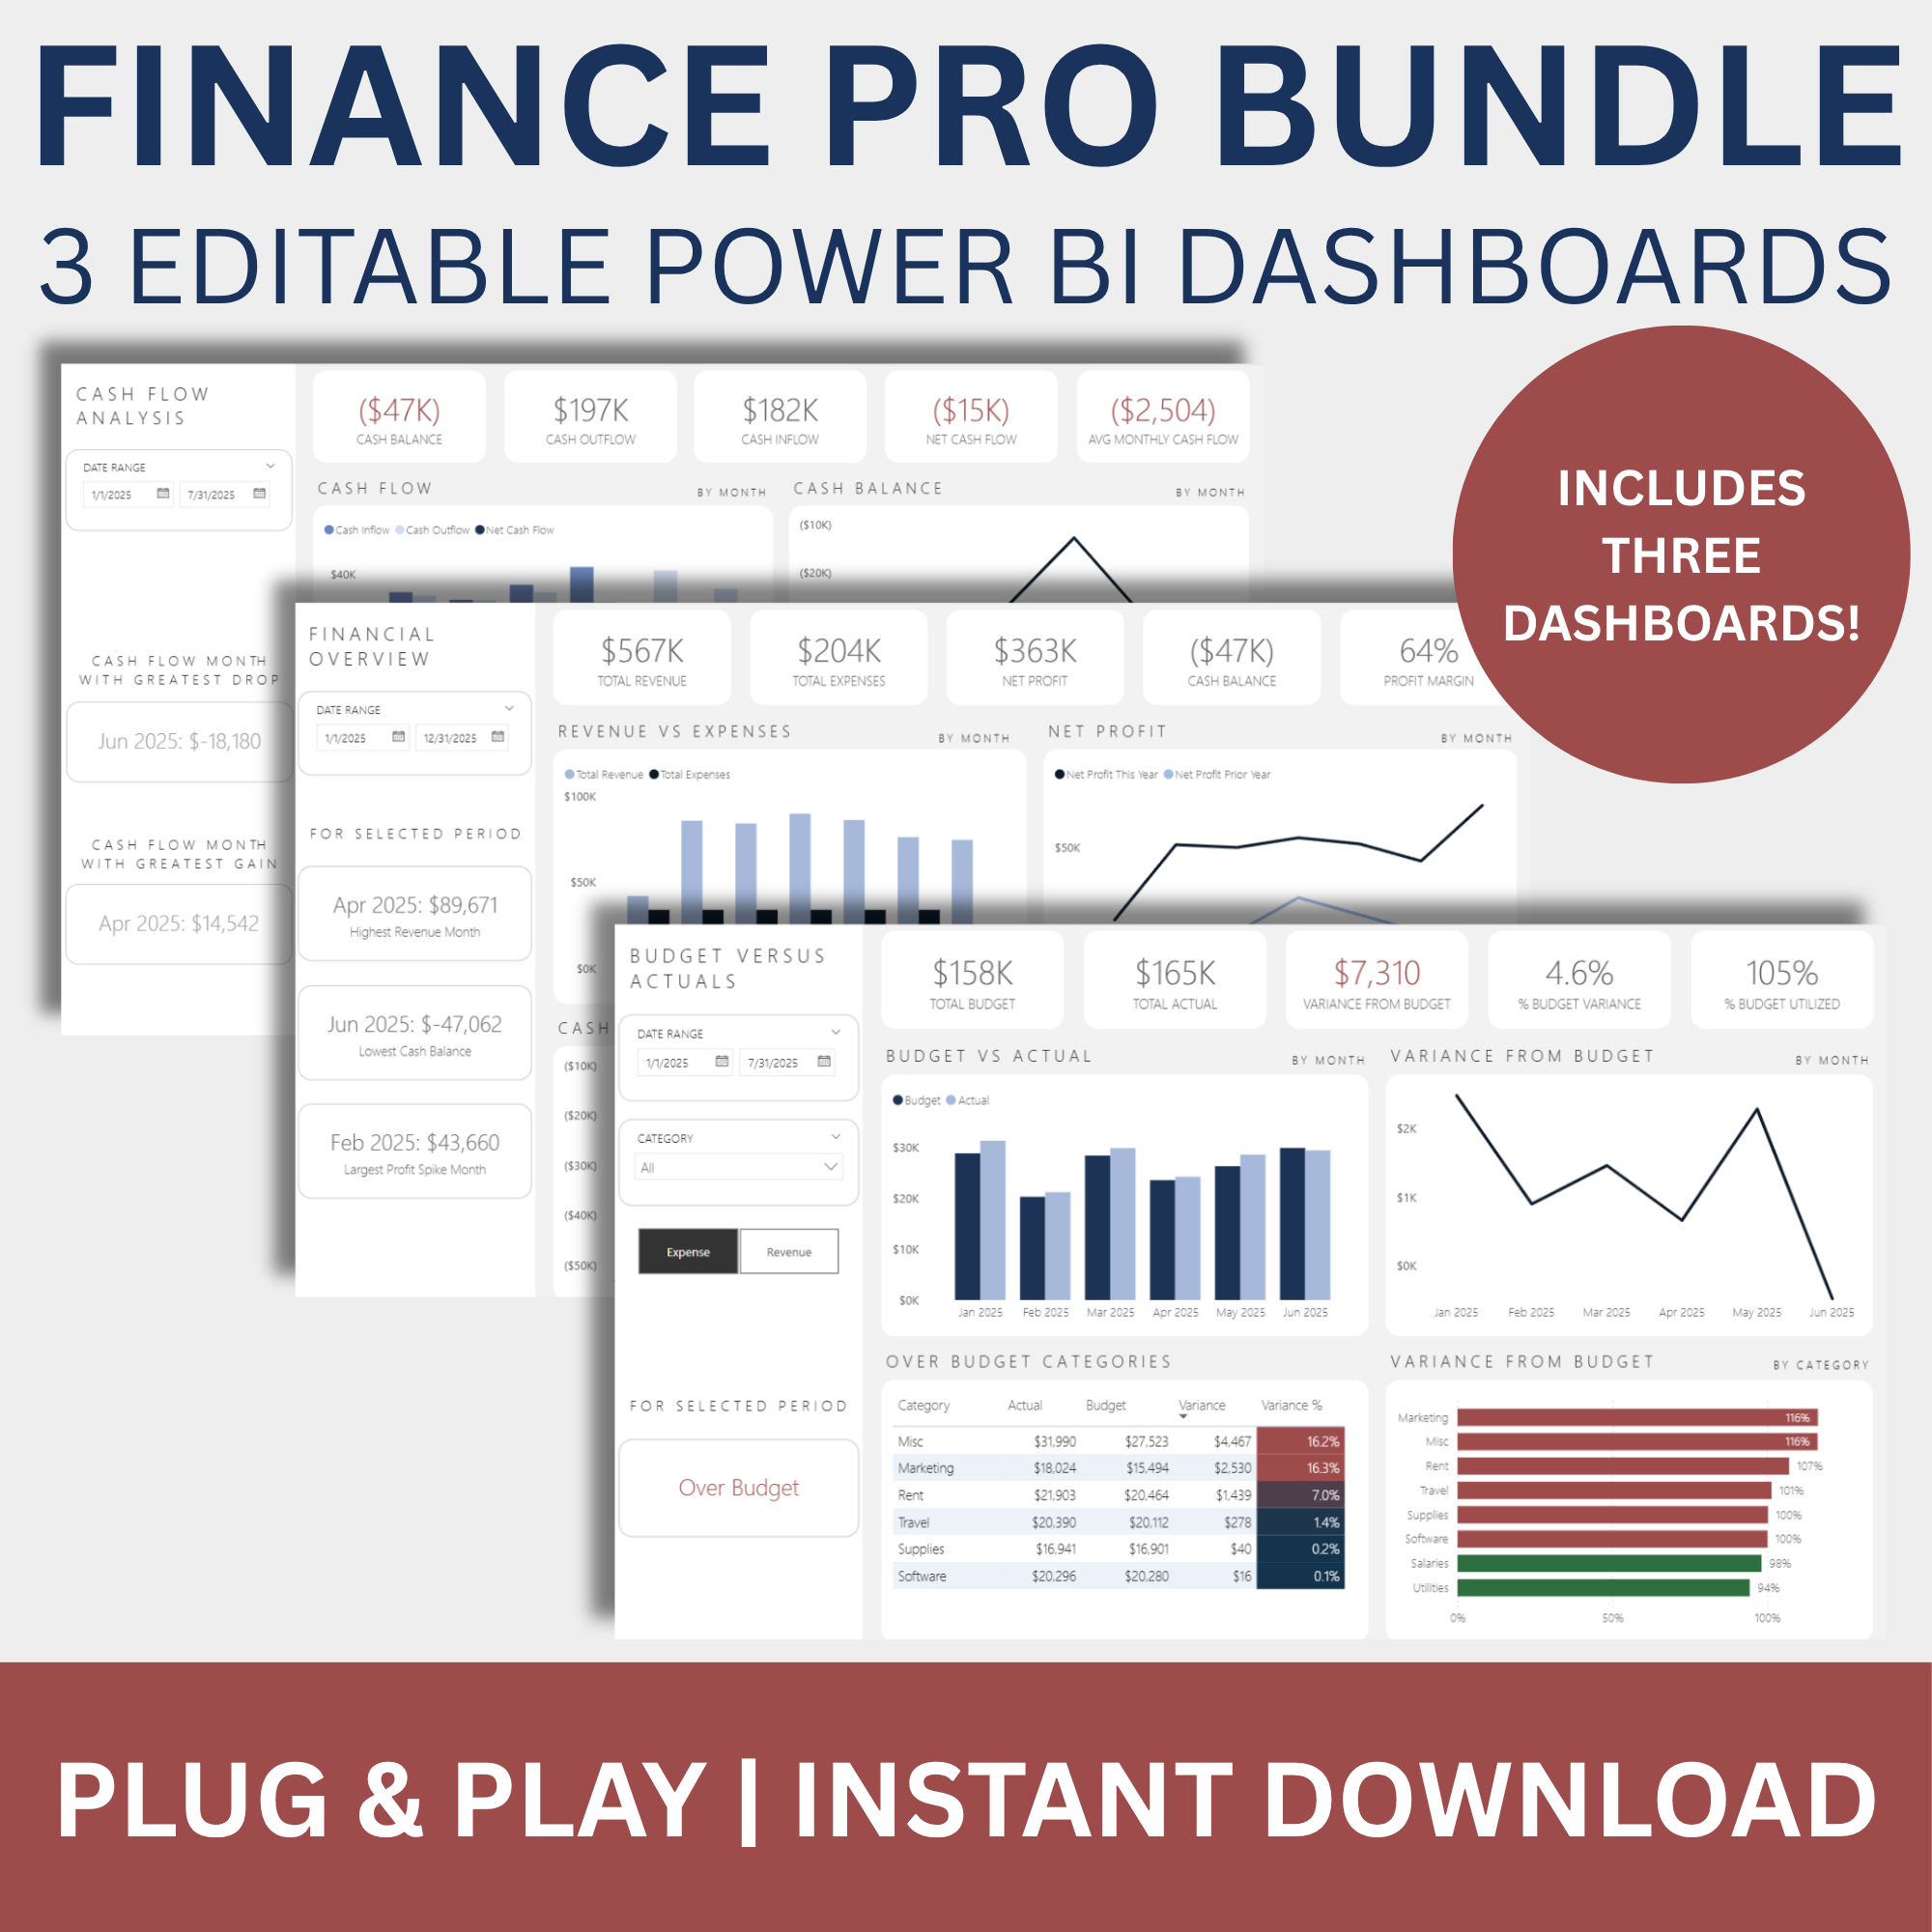 Image 7 of 7