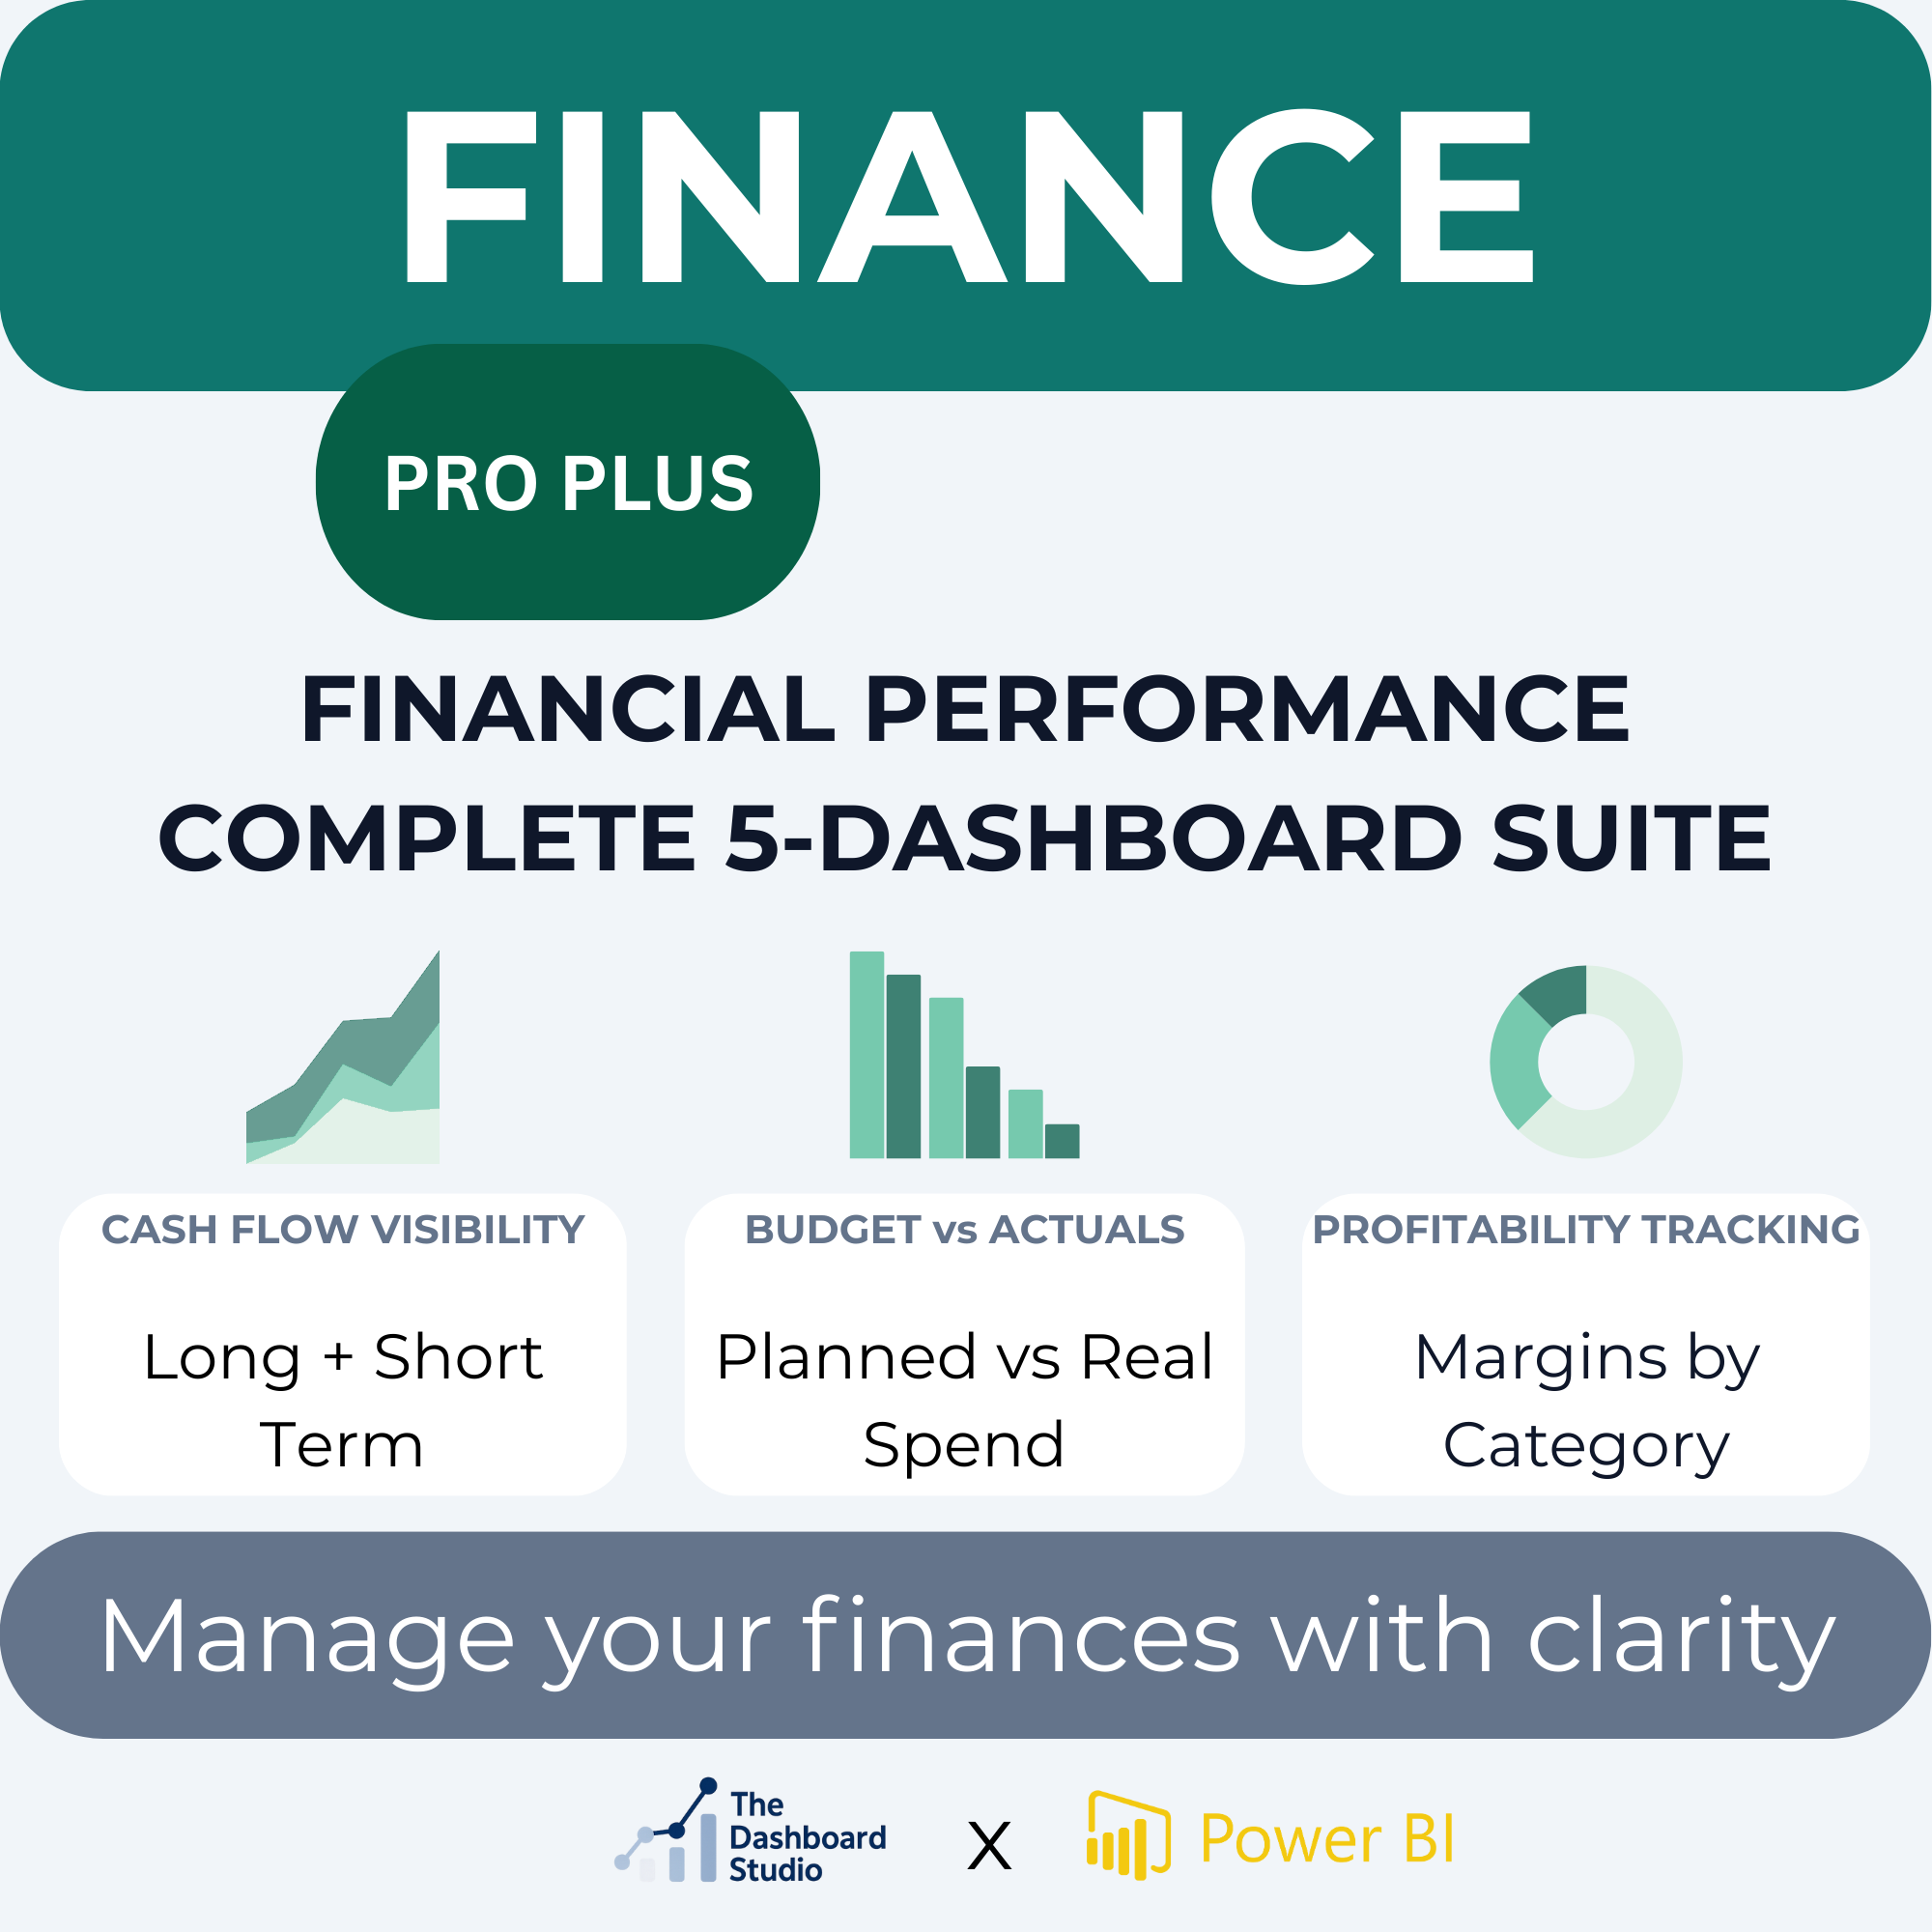
Get a complete snapshot of your business performance with the Financial Overview Dashboard — a high-level Power BI report that brings together revenue, expenses, profit, and cash flow in one clean, executive-ready view.
Instant Digital Download — Your dashboard will be delivered to your email immediately after checkout. No waiting, no shipping.
Key Features:
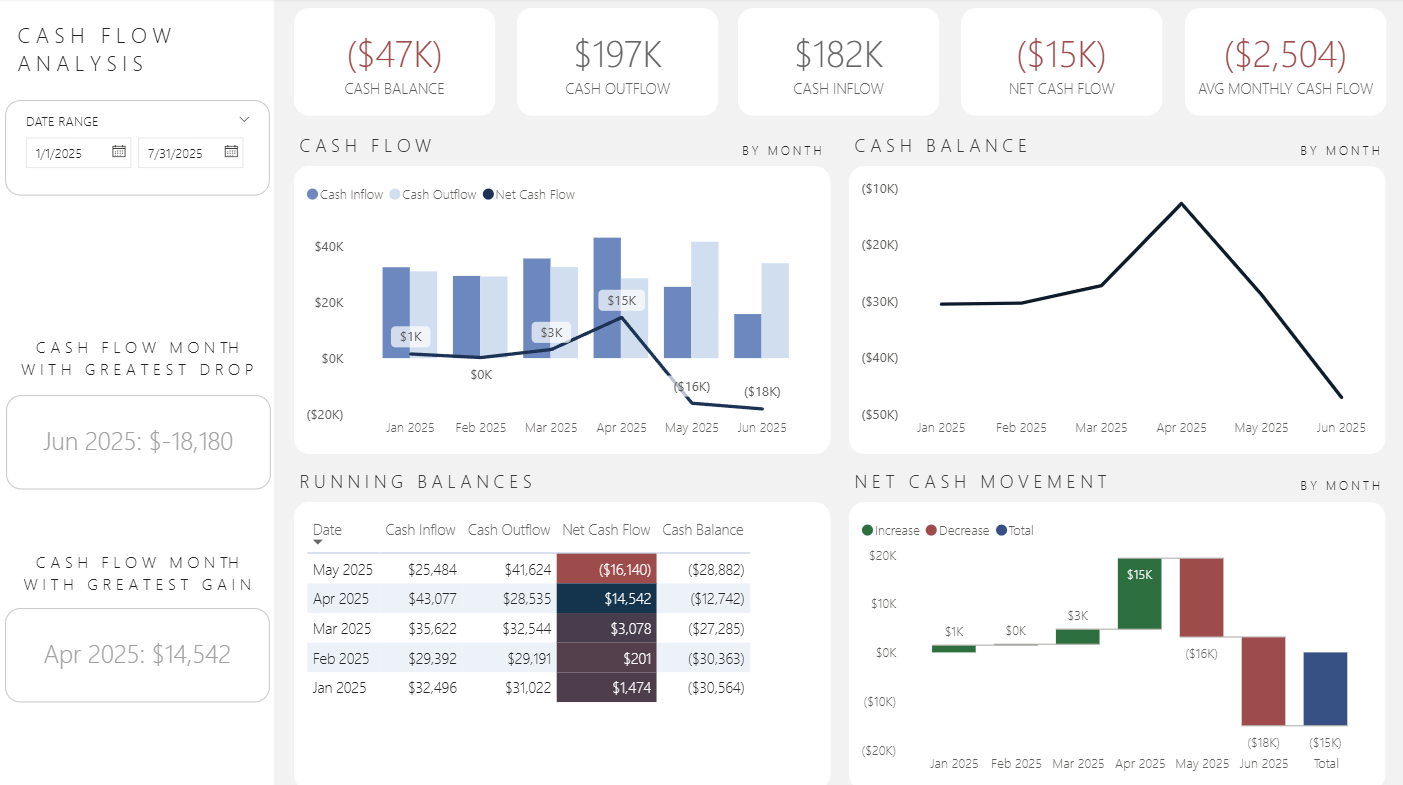
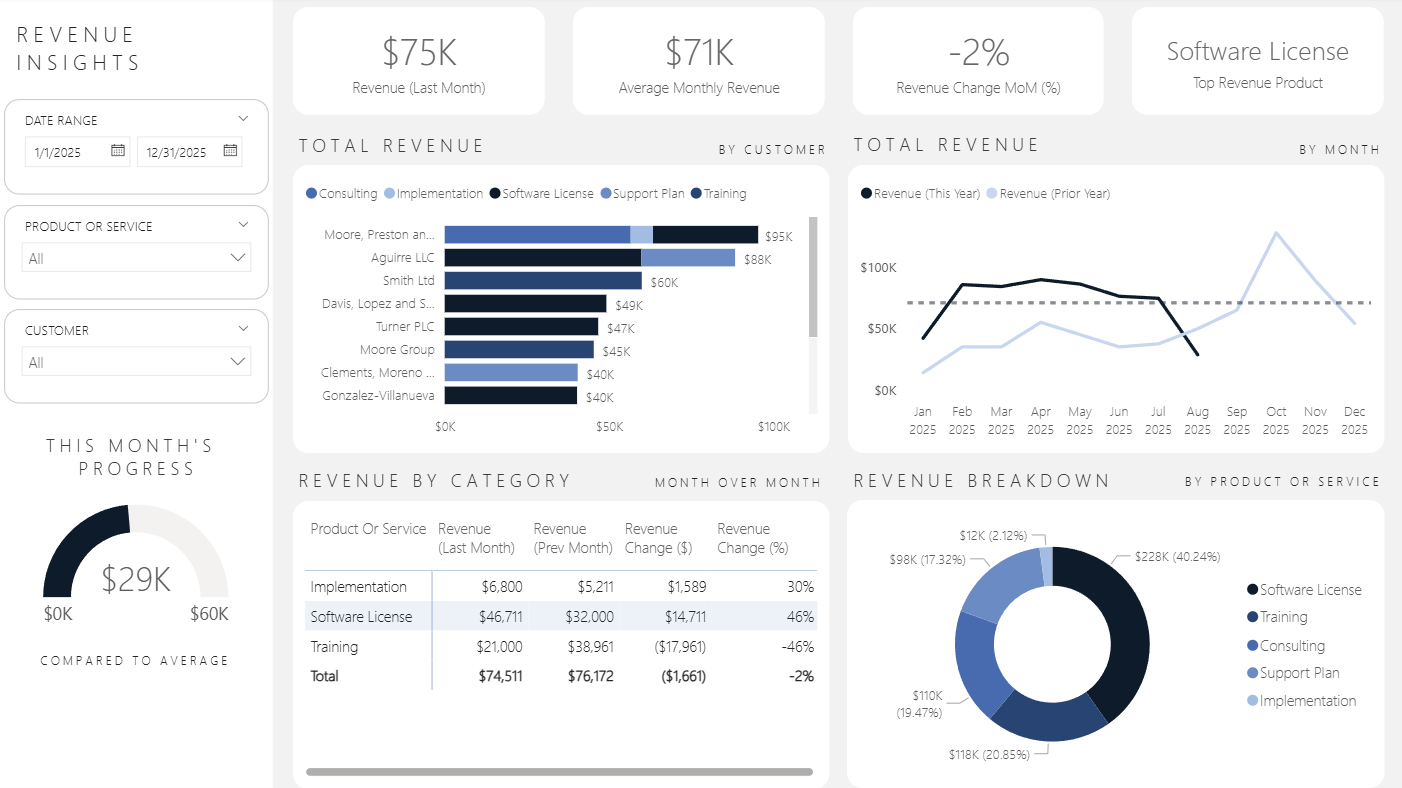
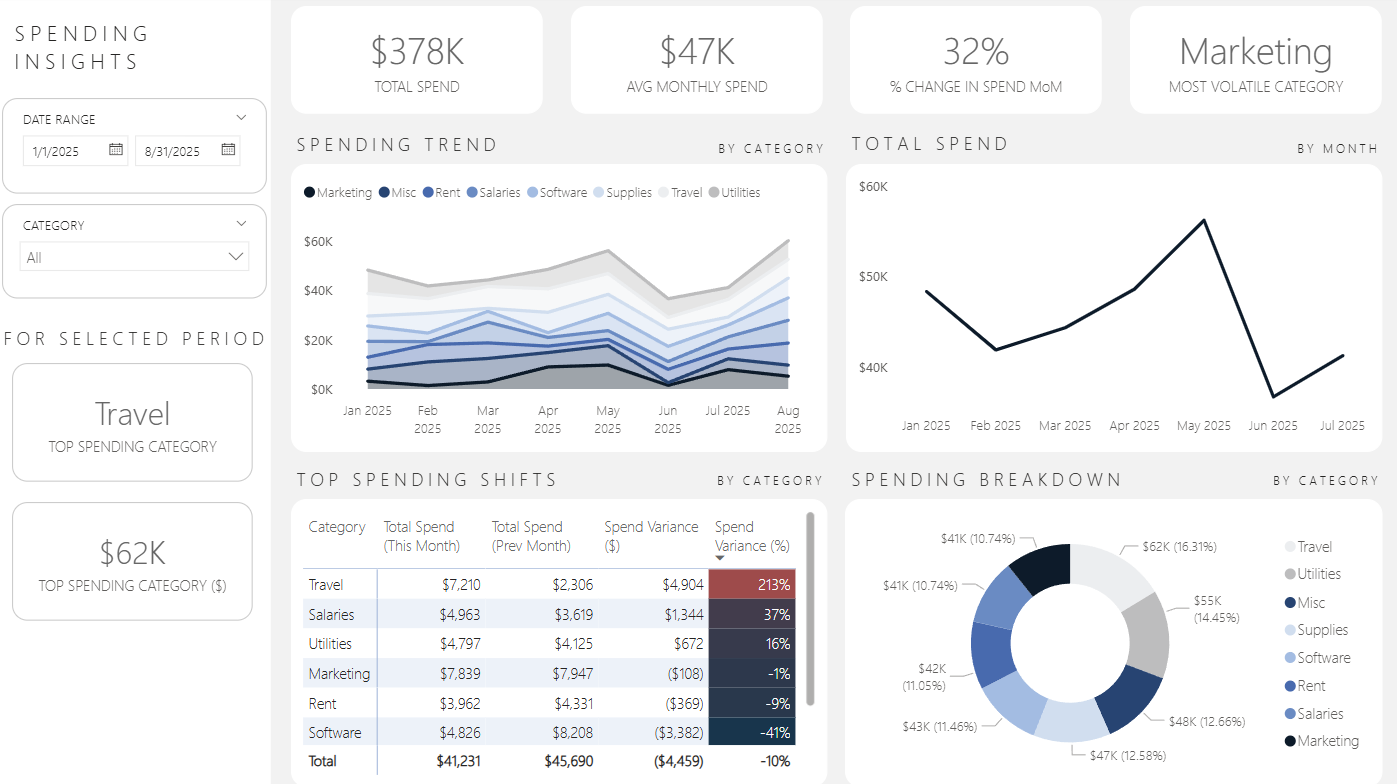
KPI cards for total revenue, total expenses, net profit, and cash balance
Monthly trends for revenue, expenses, and cash movement
Callouts for highest revenue month and lowest cash balance
Net profit margin analysis
Designed for top-level insights across your full financial picture
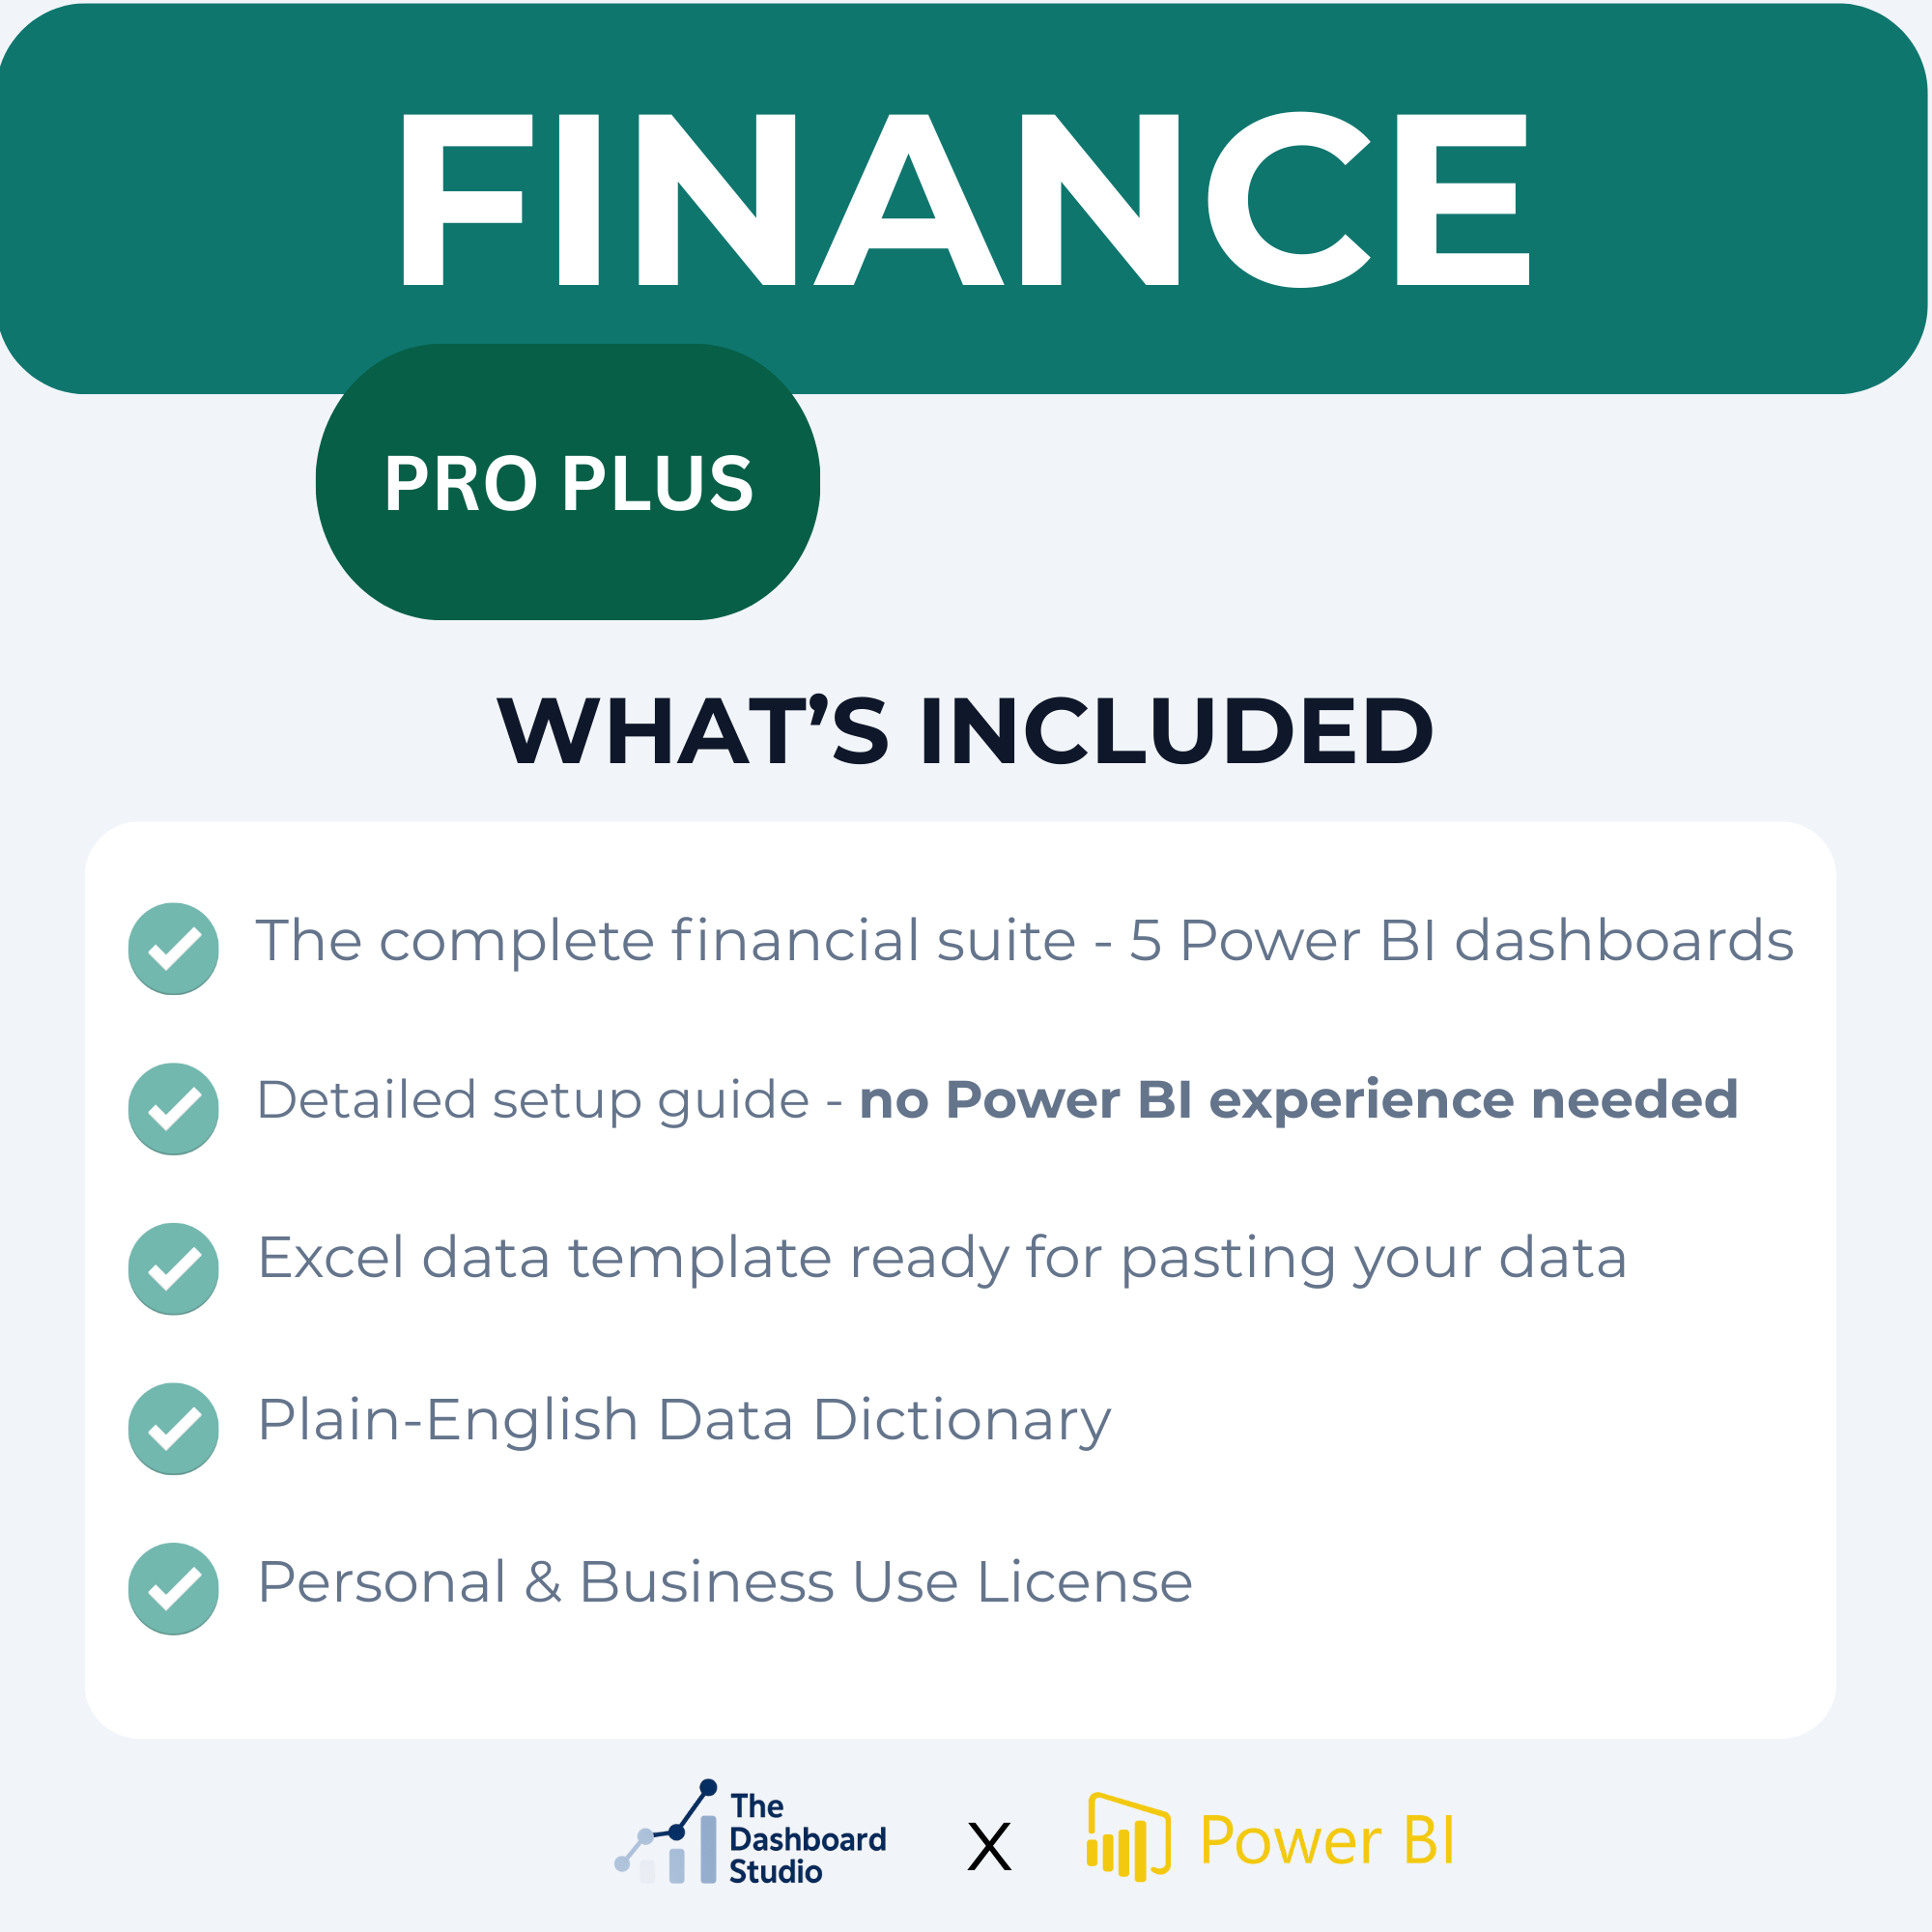
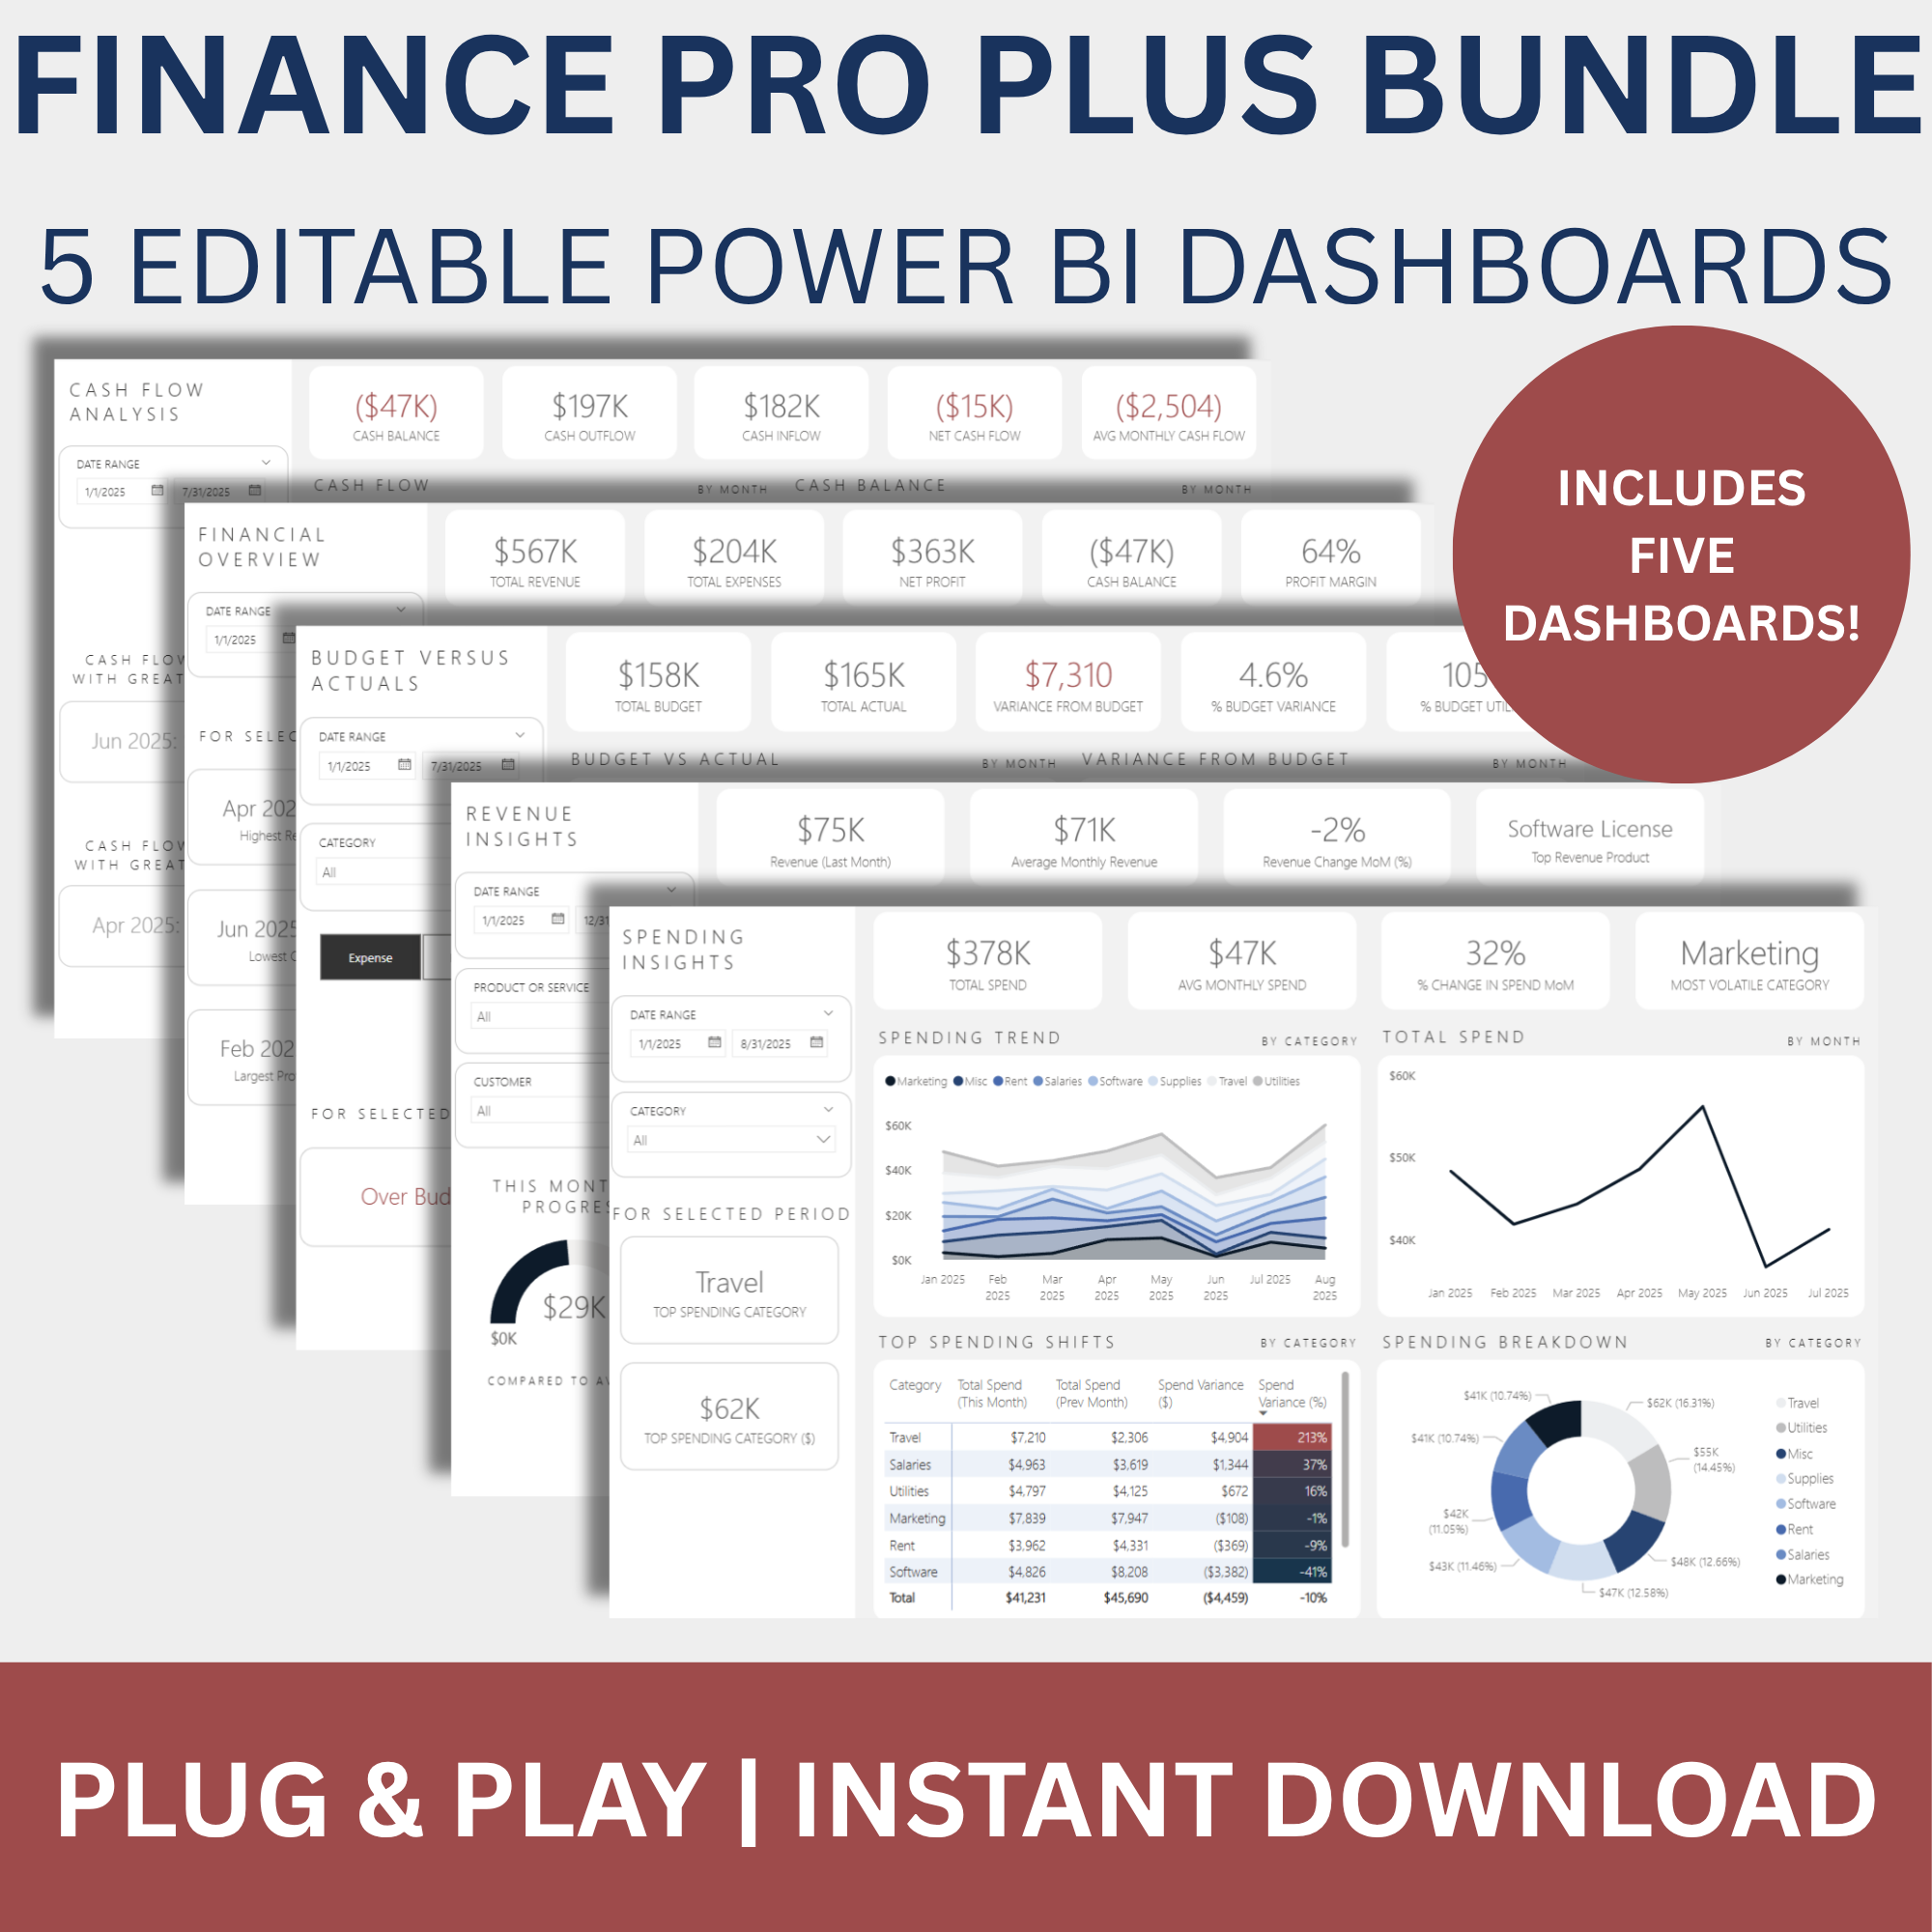
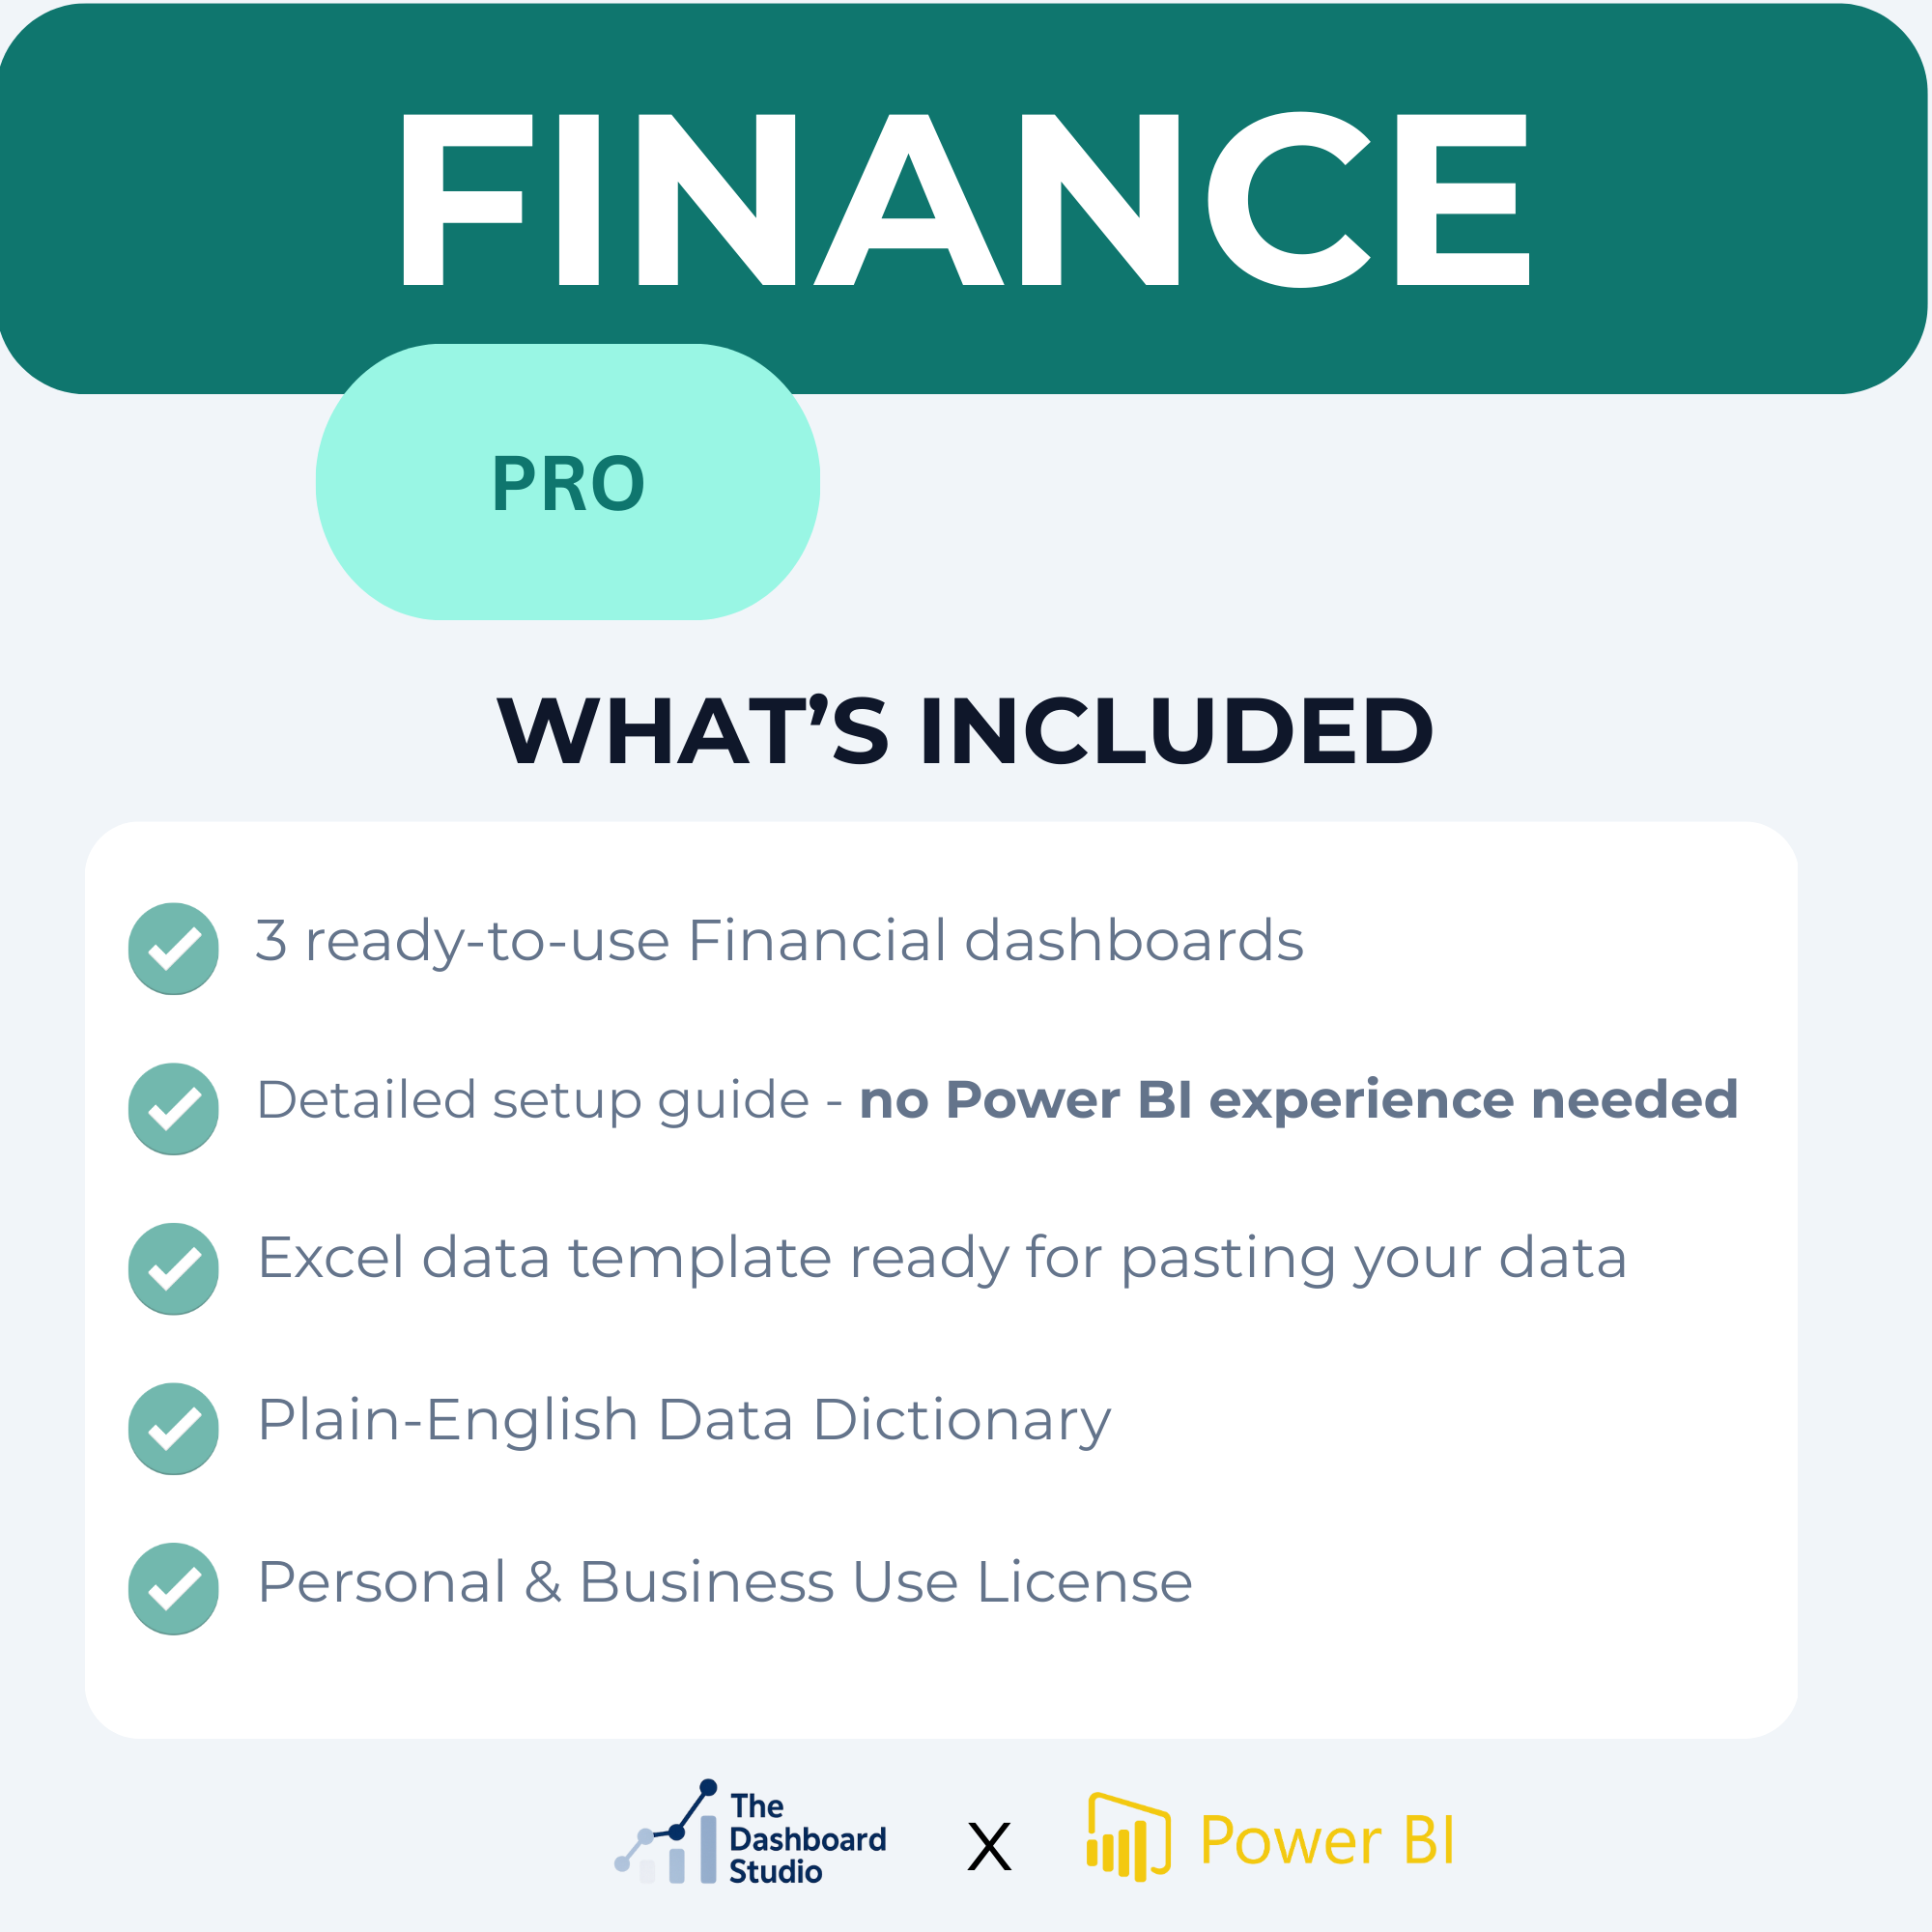
What You Get:
Ideal for business owners, executives, or advisors who need fast, reliable insight into company performance—without digging through spreadsheets.
Scroll down to see a video walkthrough of this dashboard.
Get a complete snapshot of your business performance with the Financial Overview Dashboard — a high-level Power BI report that brings together revenue, expenses, profit, and cash flow in one clean, executive-ready view.
Instant Digital Download — Your dashboard will be delivered to your email immediately after checkout. No waiting, no shipping.
Key Features:
KPI cards for total revenue, total expenses, net profit, and cash balance
Monthly trends for revenue, expenses, and cash movement
Callouts for highest revenue month and lowest cash balance
Net profit margin analysis
Designed for top-level insights across your full financial picture
What You Get:
Ideal for business owners, executives, or advisors who need fast, reliable insight into company performance—without digging through spreadsheets.
Scroll down to see a video walkthrough of this dashboard.

 Image 1 of 5
 Image 2 of 5
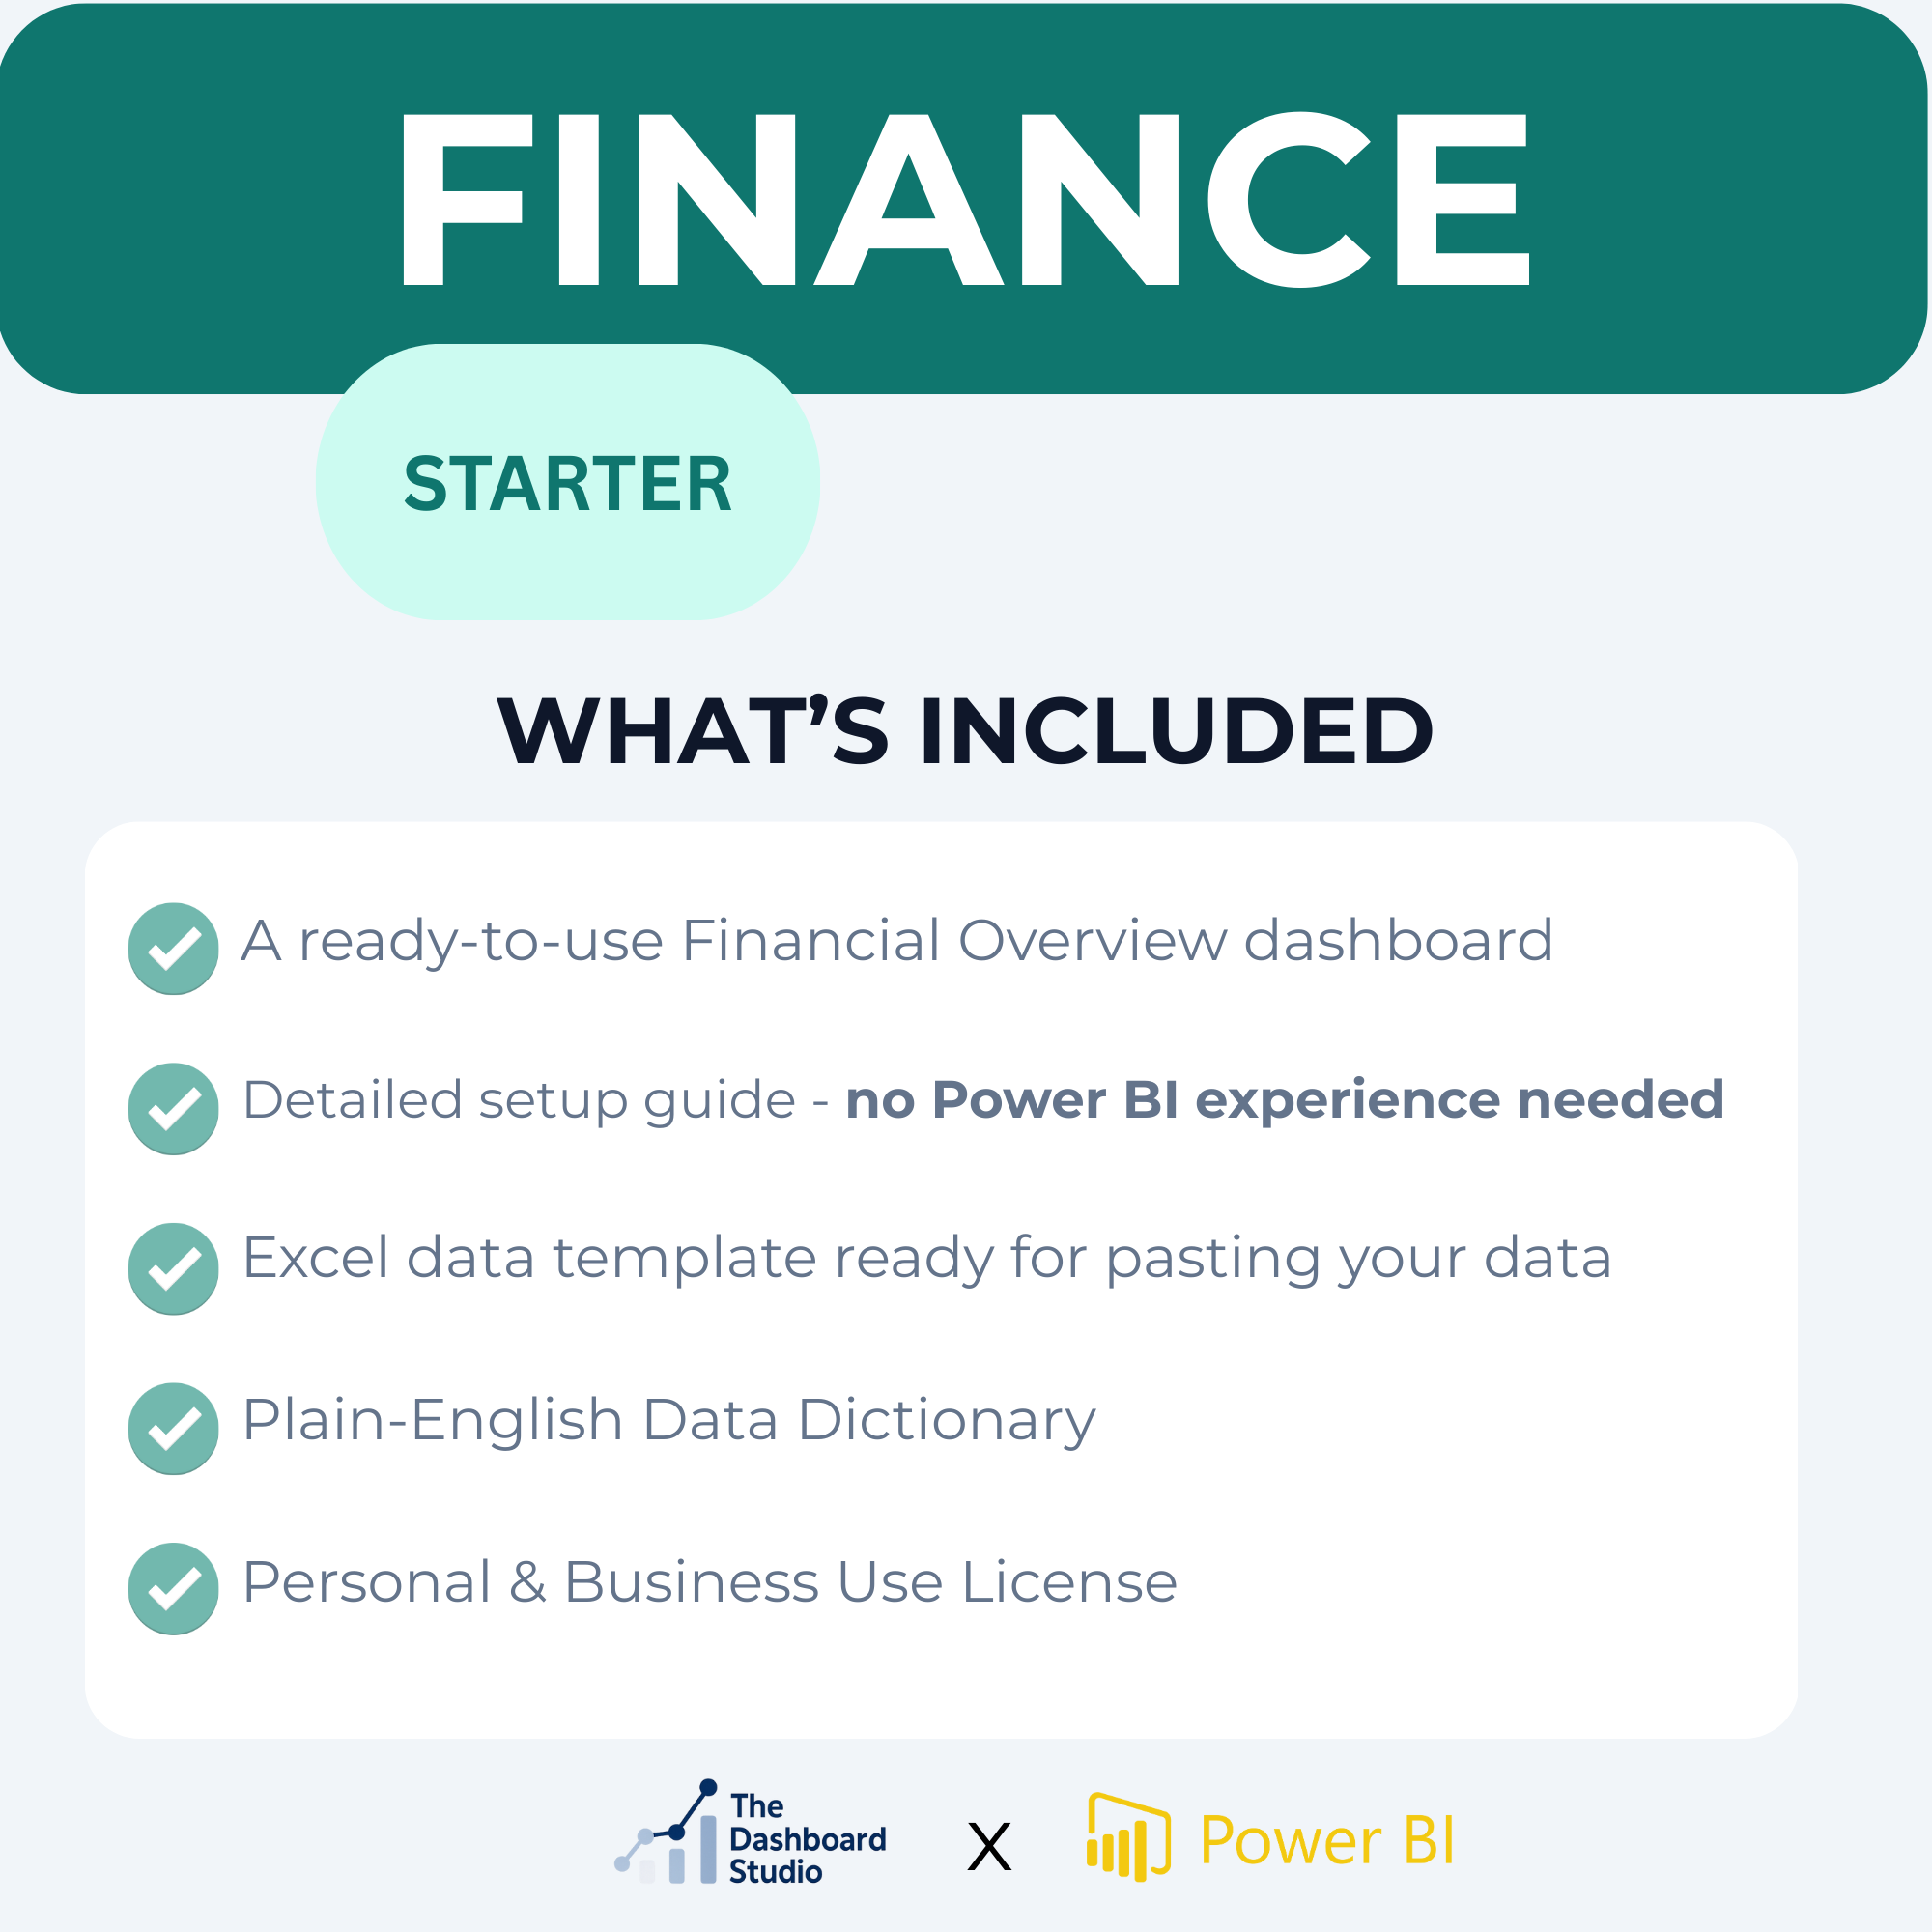 Image 3 of 5
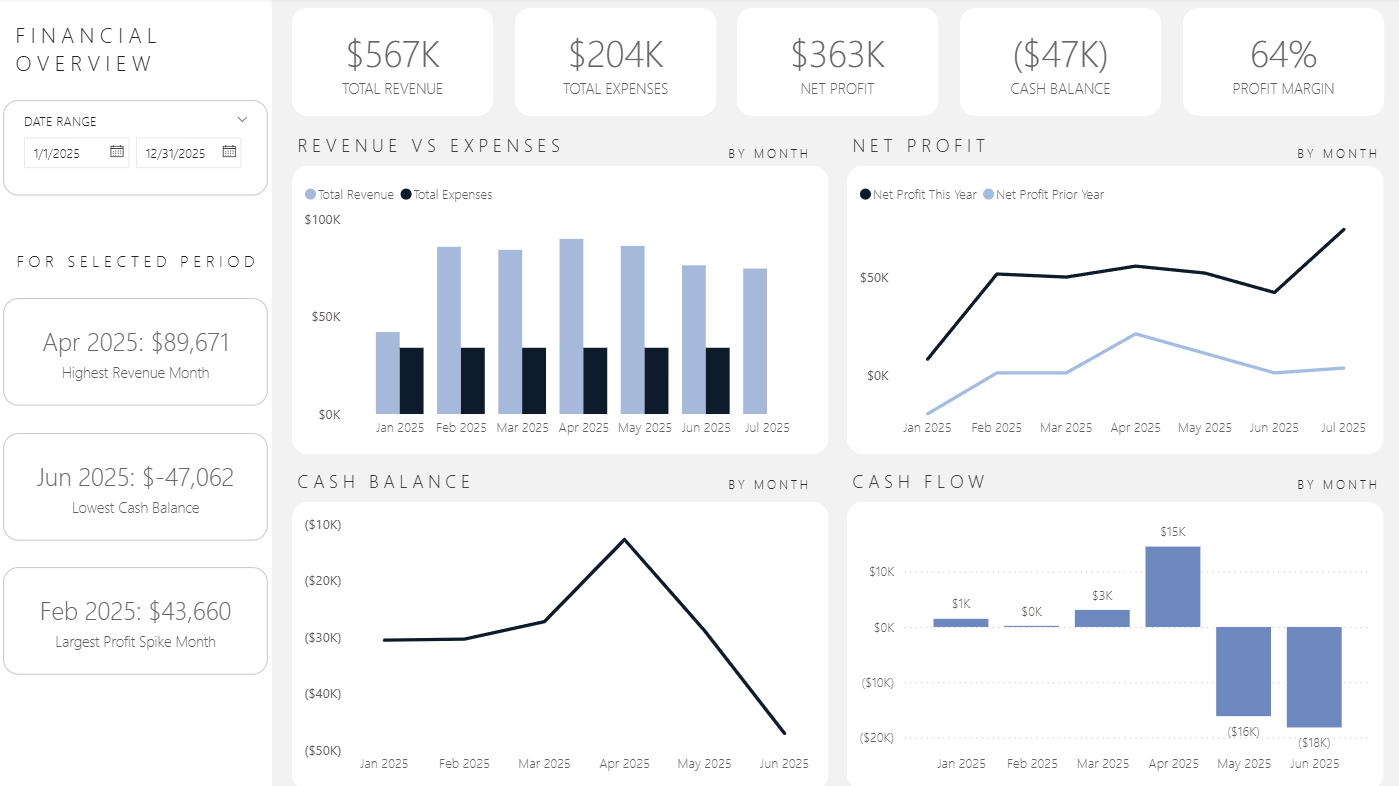 Image 4 of 5
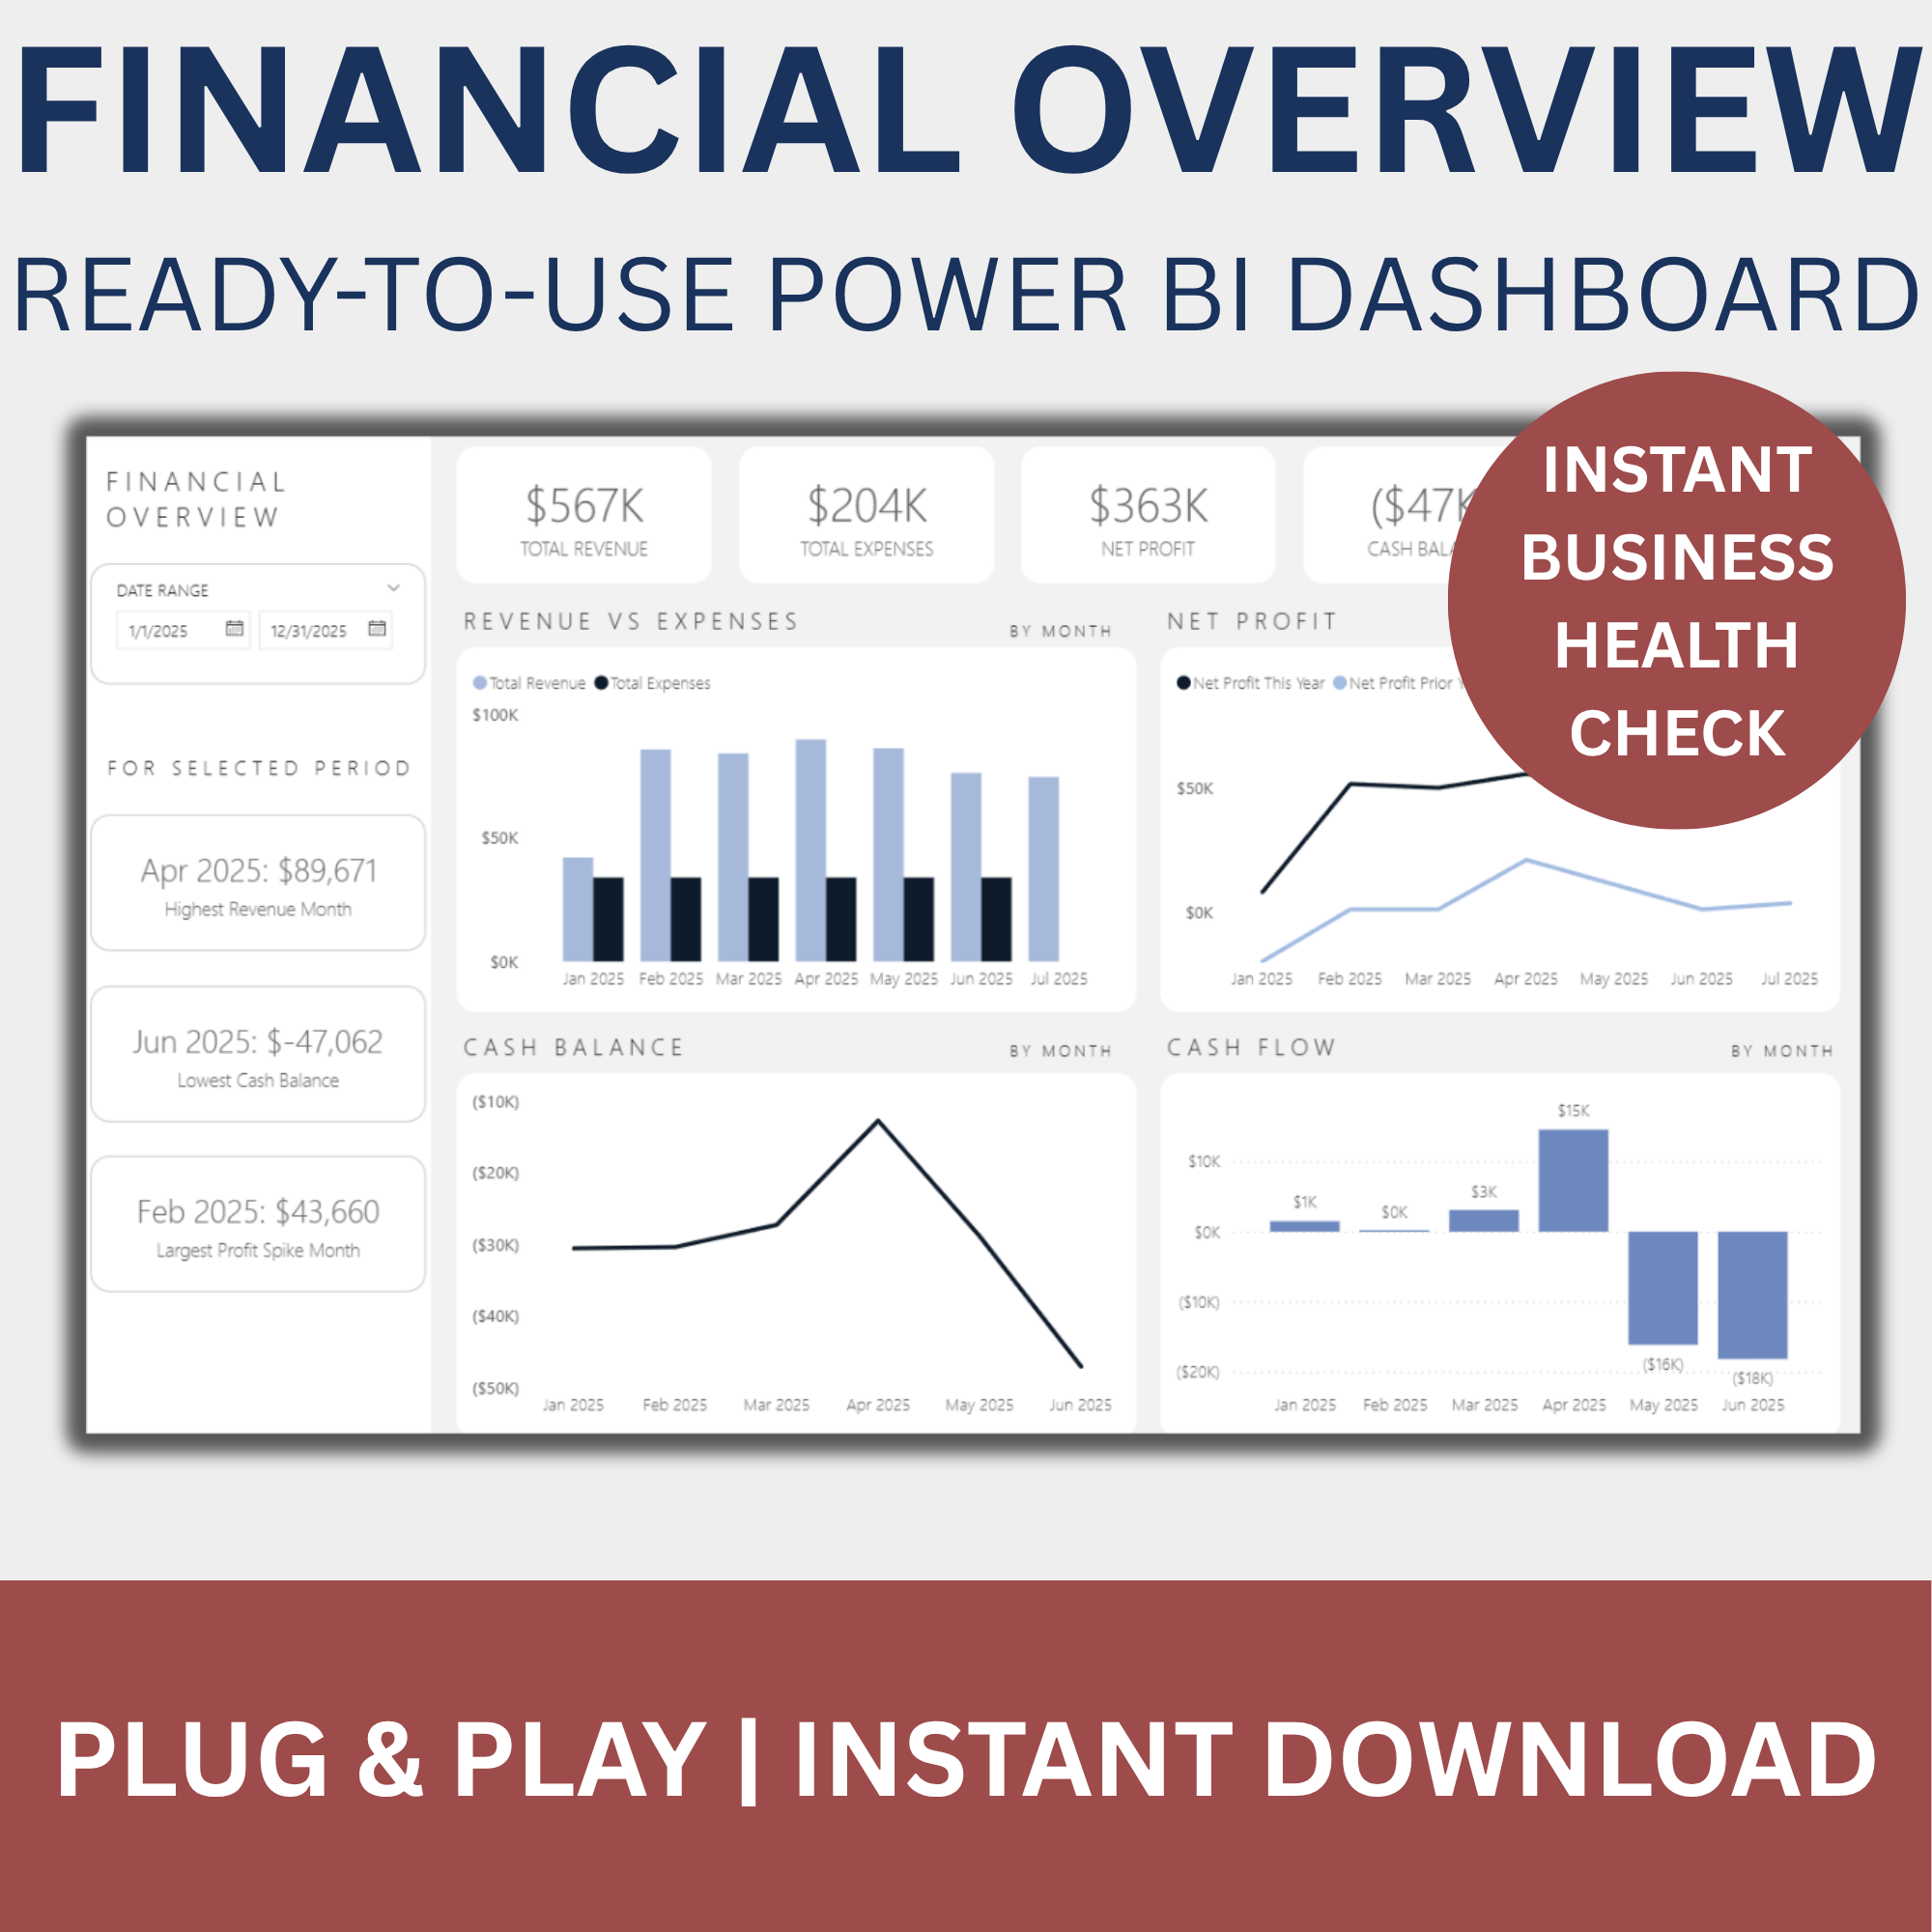 Image 5 of 5