 Image 1 of 2
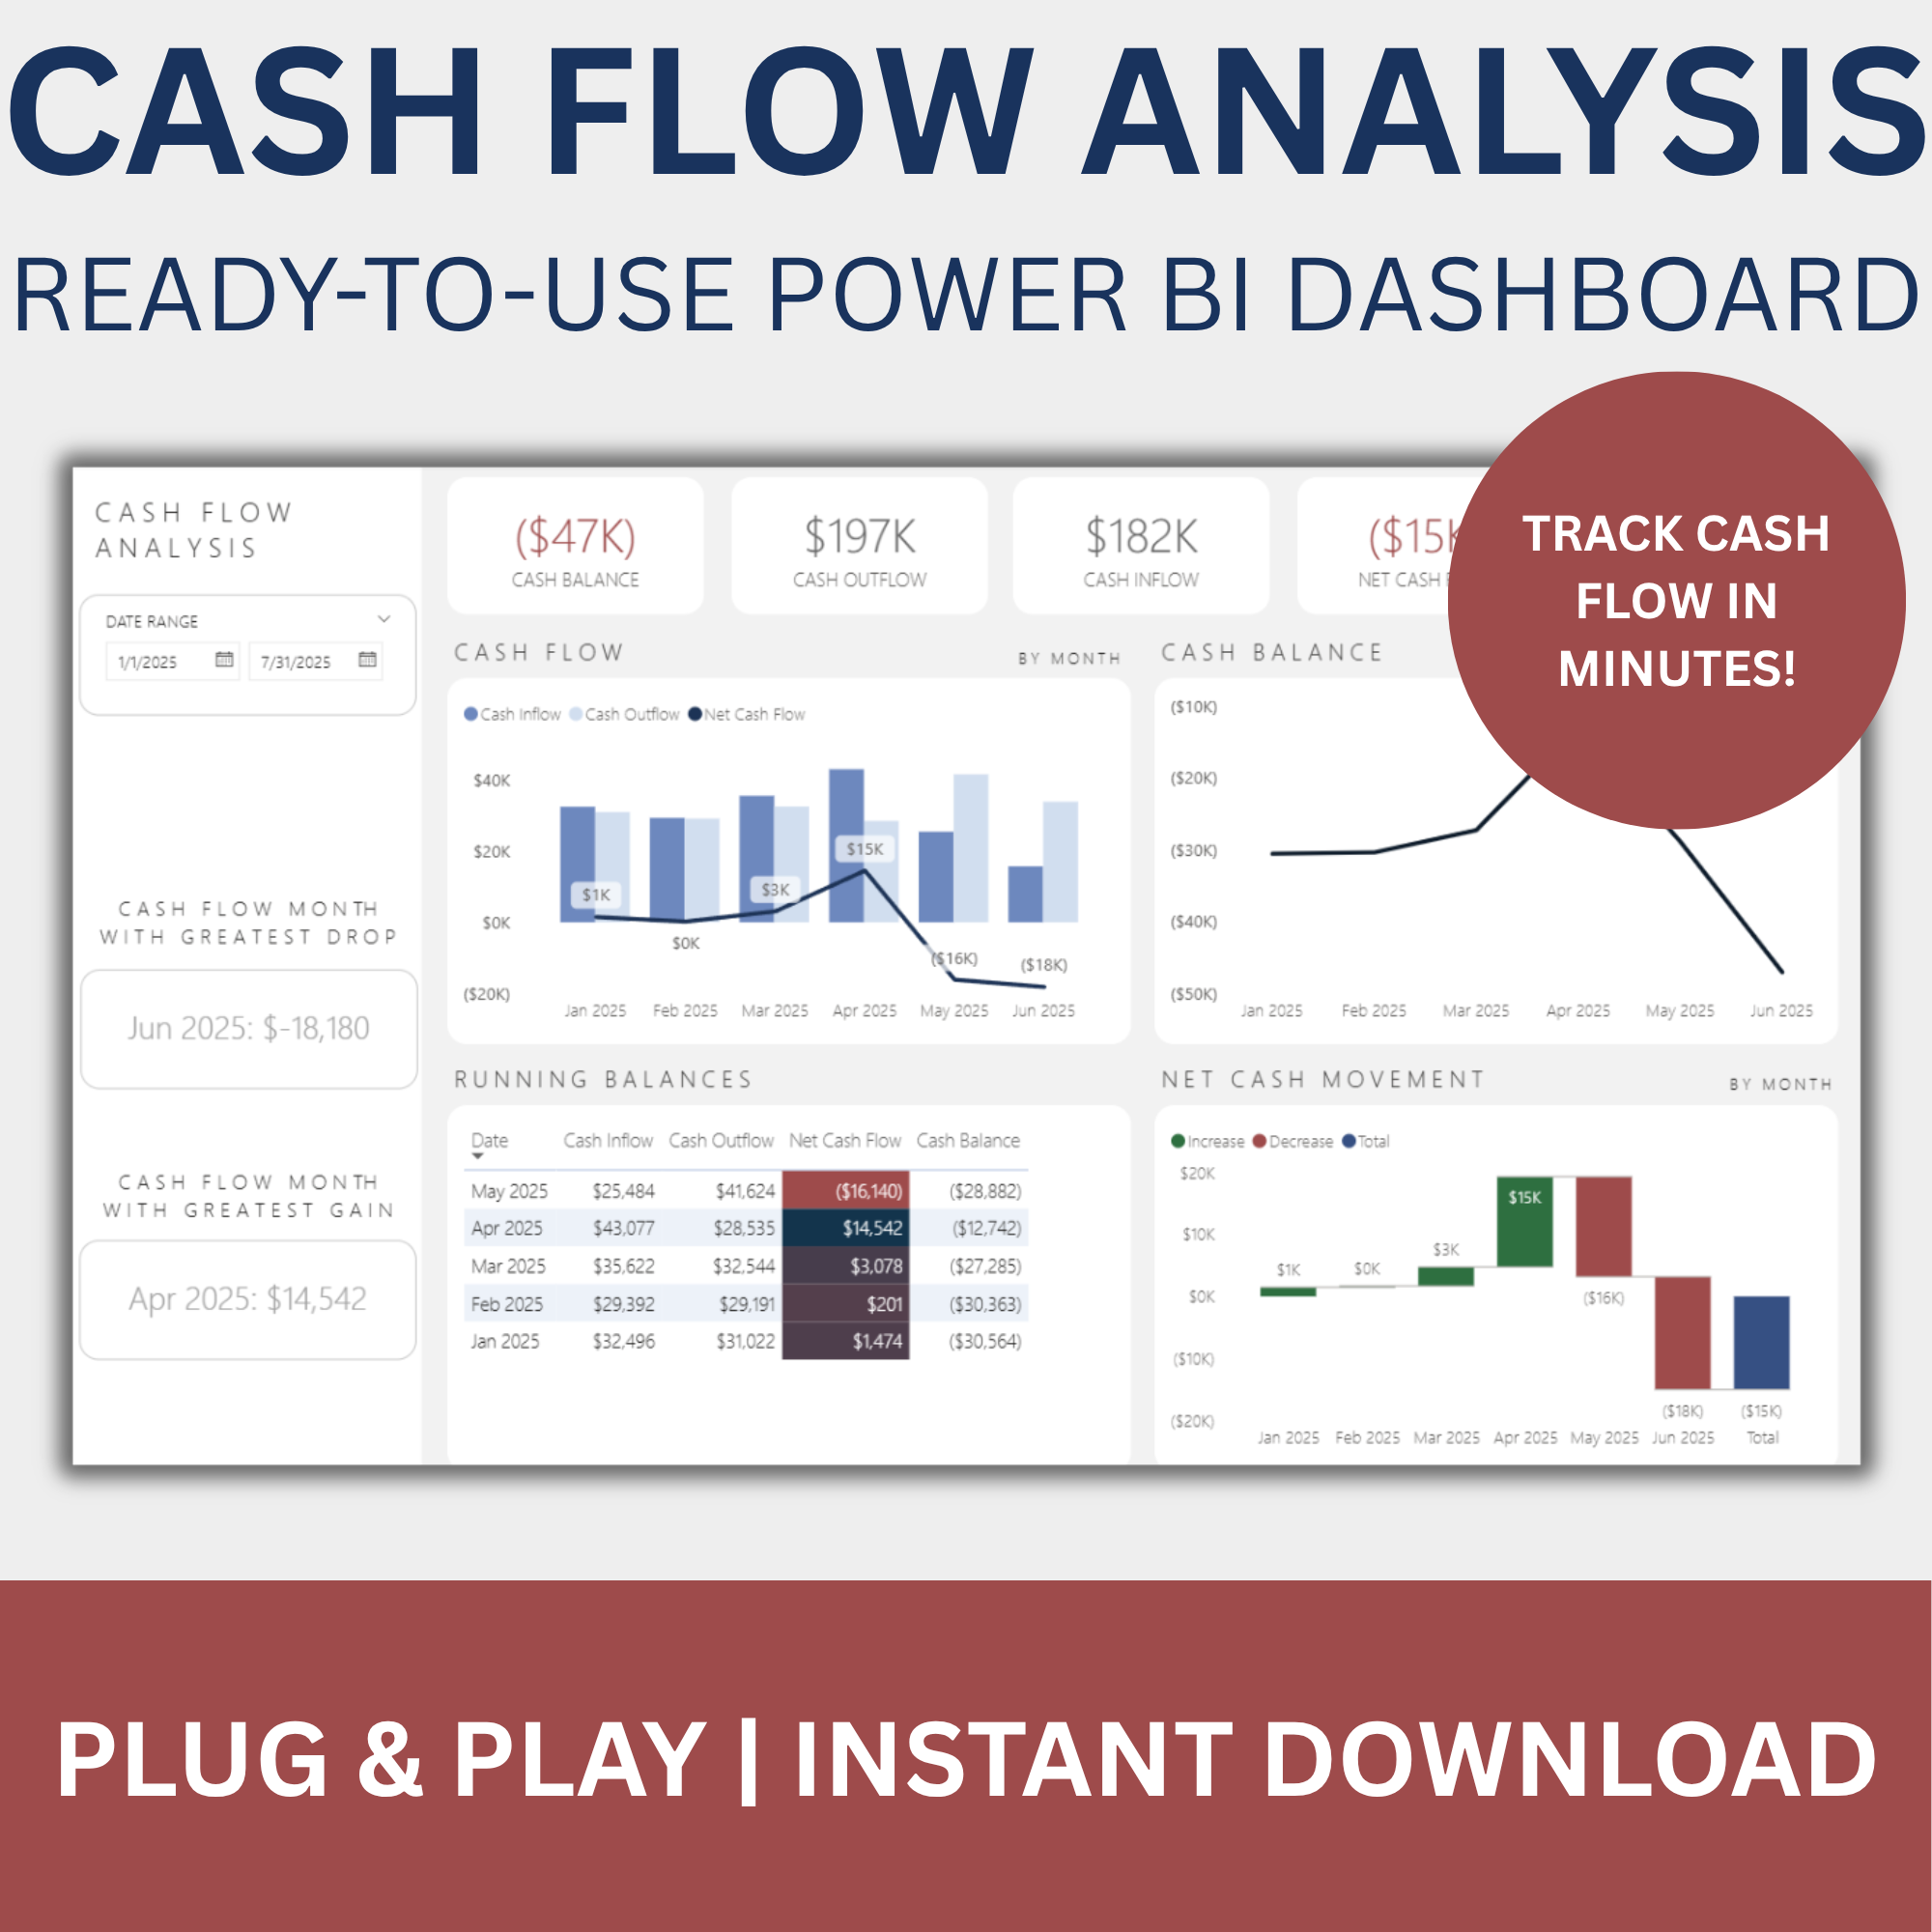 Image 2 of 2
Cash Flow Analysis Dashboard
$39.00
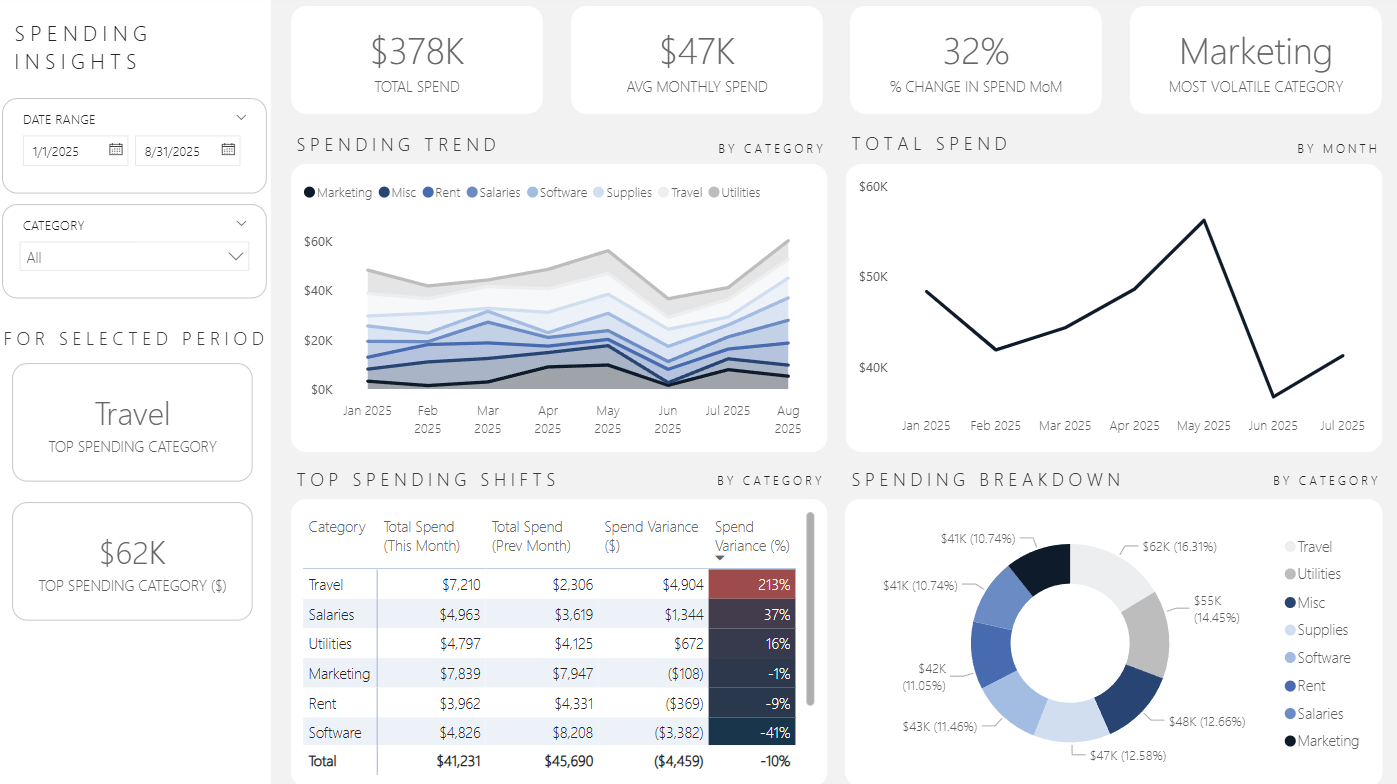
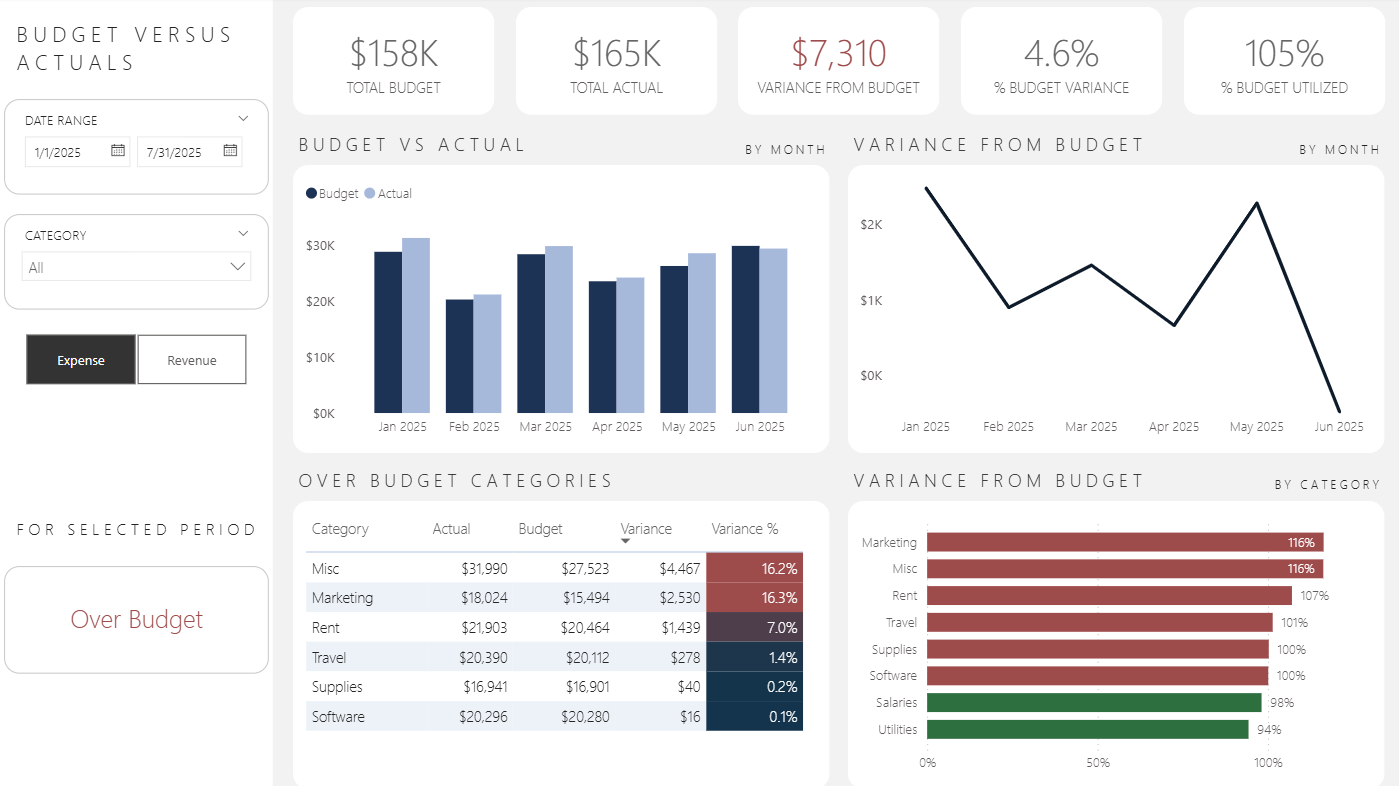
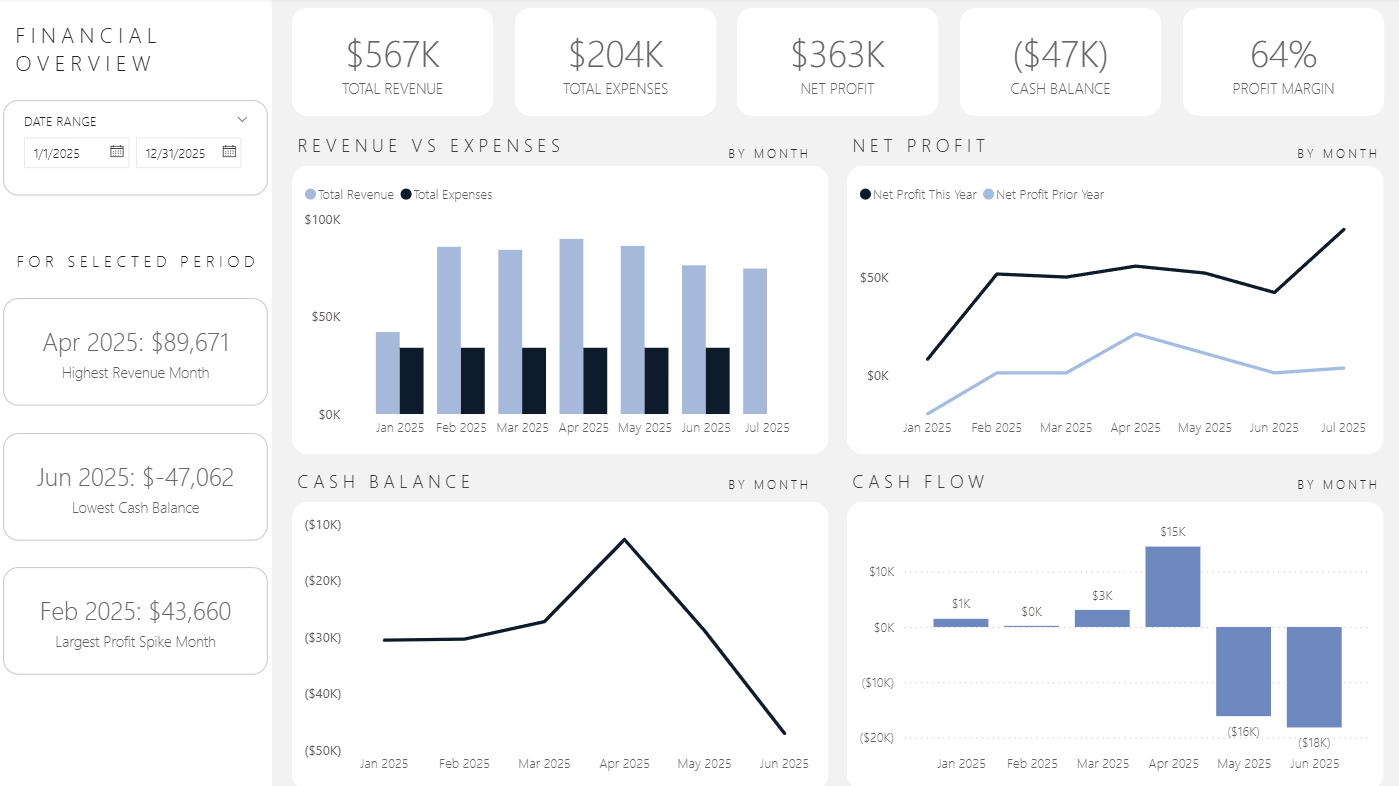
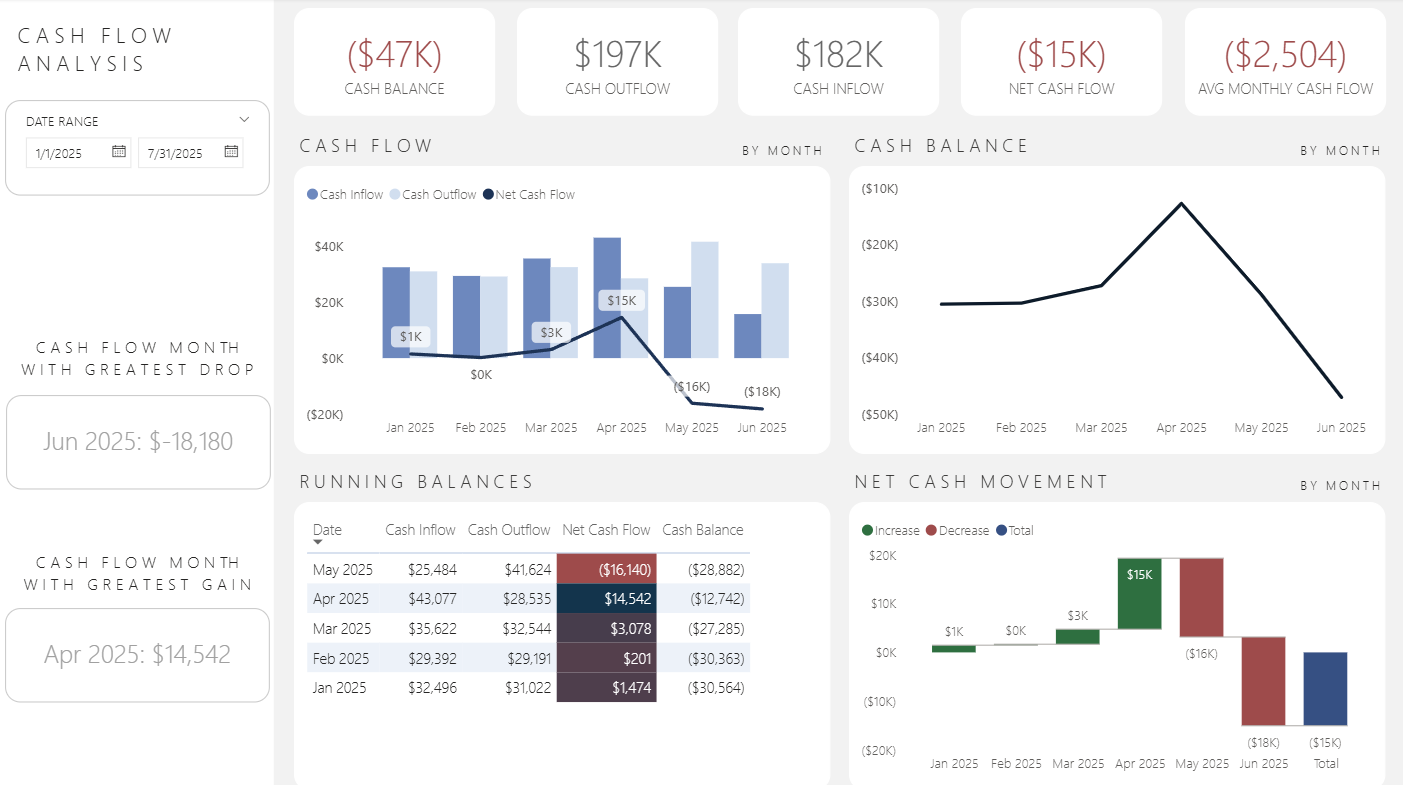
Visualize how money moves through your business with the Cash Flow Analysis Dashboard — a powerful Power BI report that helps you track inflows, outflows, and net cash position over time. Designed to make cash flow insights easy and actionable.
Instant Digital Download — Your dashboard will be delivered to your email immediately after checkout. No waiting, no shipping.
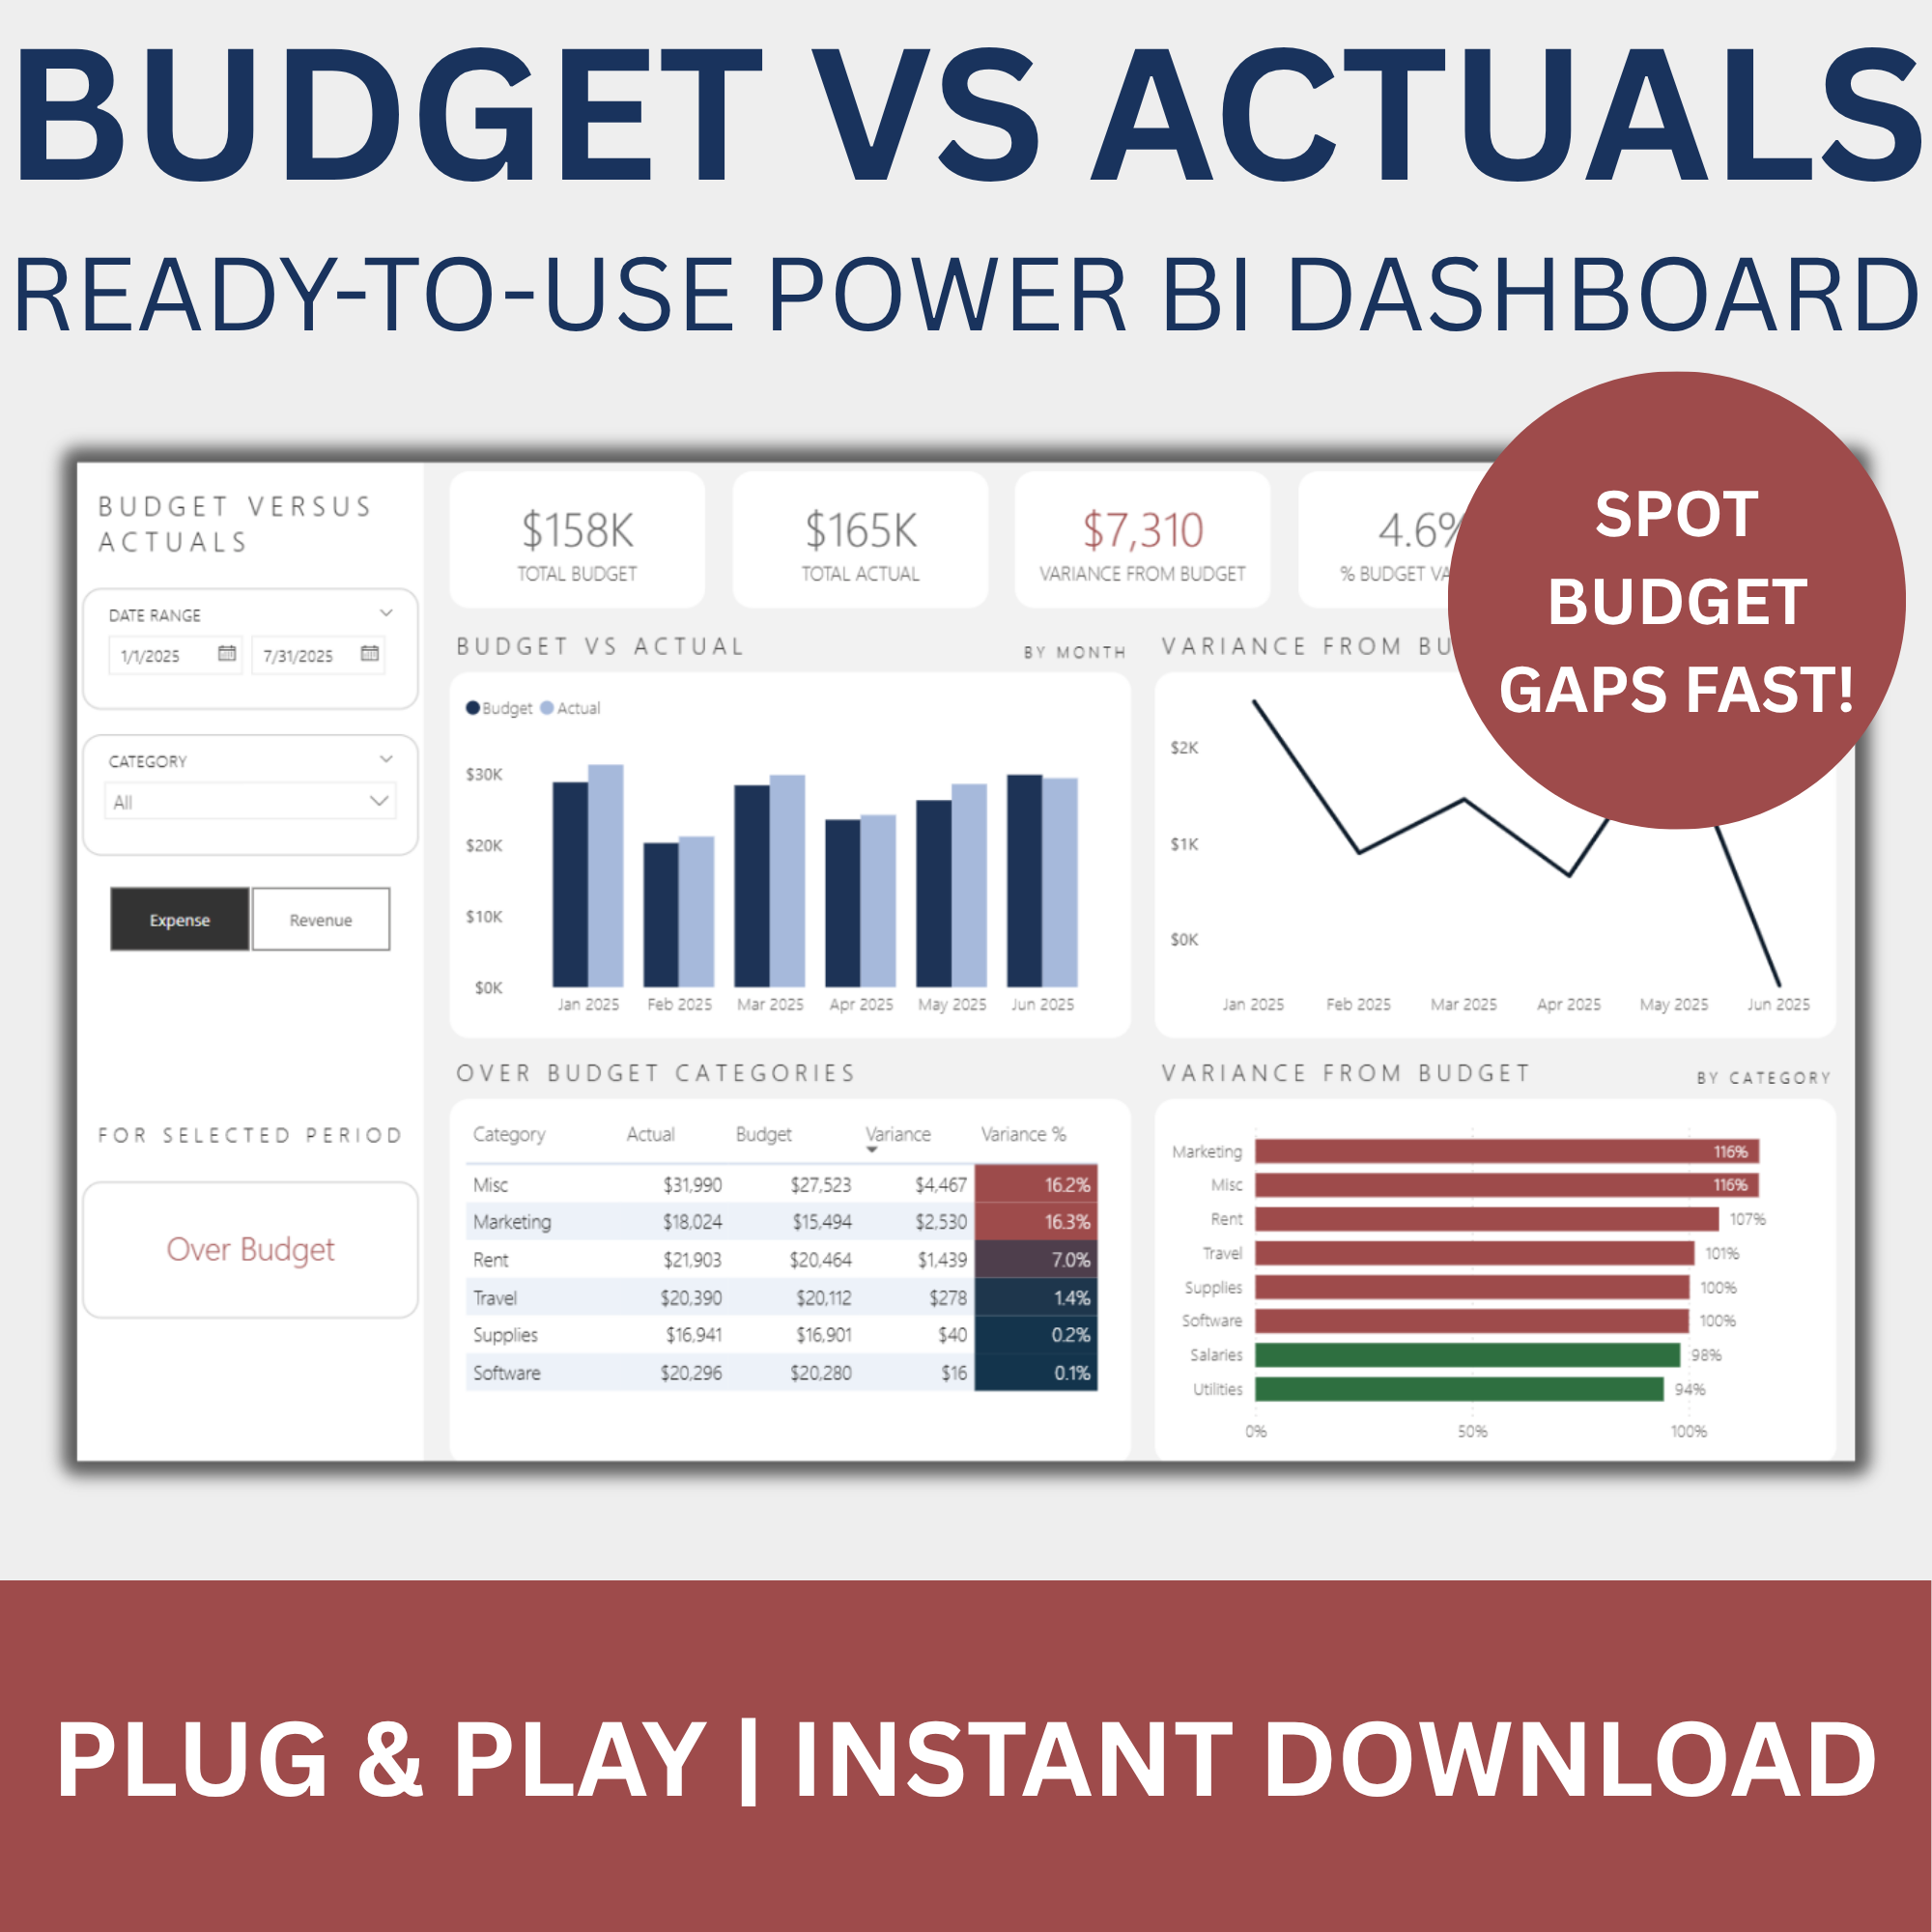
Key Features:
Waterfall chart showing net cash flow month over month
Line chart tracking total cash balance
KPI cards for total inflows, outflows, and average monthly cash flow
Callout for the month with the biggest drop in net cash flow
Interactive date slicer for time-based filtering
What You Get:
Power BI (.pbix) dashboard file
Sample Excel data source
Data dictionary
Setup guide
Commercial use license
Perfect for business owners, finance teams, and advisors looking to monitor liquidity, spot cash shortages early, and improve financial decision-making.
Visualize how money moves through your business with the Cash Flow Analysis Dashboard — a powerful Power BI report that helps you track inflows, outflows, and net cash position over time. Designed to make cash flow insights easy and actionable.
Instant Digital Download — Your dashboard will be delivered to your email immediately after checkout. No waiting, no shipping.
Key Features:
Waterfall chart showing net cash flow month over month
Line chart tracking total cash balance
KPI cards for total inflows, outflows, and average monthly cash flow
Callout for the month with the biggest drop in net cash flow
Interactive date slicer for time-based filtering
What You Get:
Power BI (.pbix) dashboard file
Sample Excel data source
Data dictionary
Setup guide
Commercial use license
Perfect for business owners, finance teams, and advisors looking to monitor liquidity, spot cash shortages early, and improve financial decision-making.