 Image 1 of 2
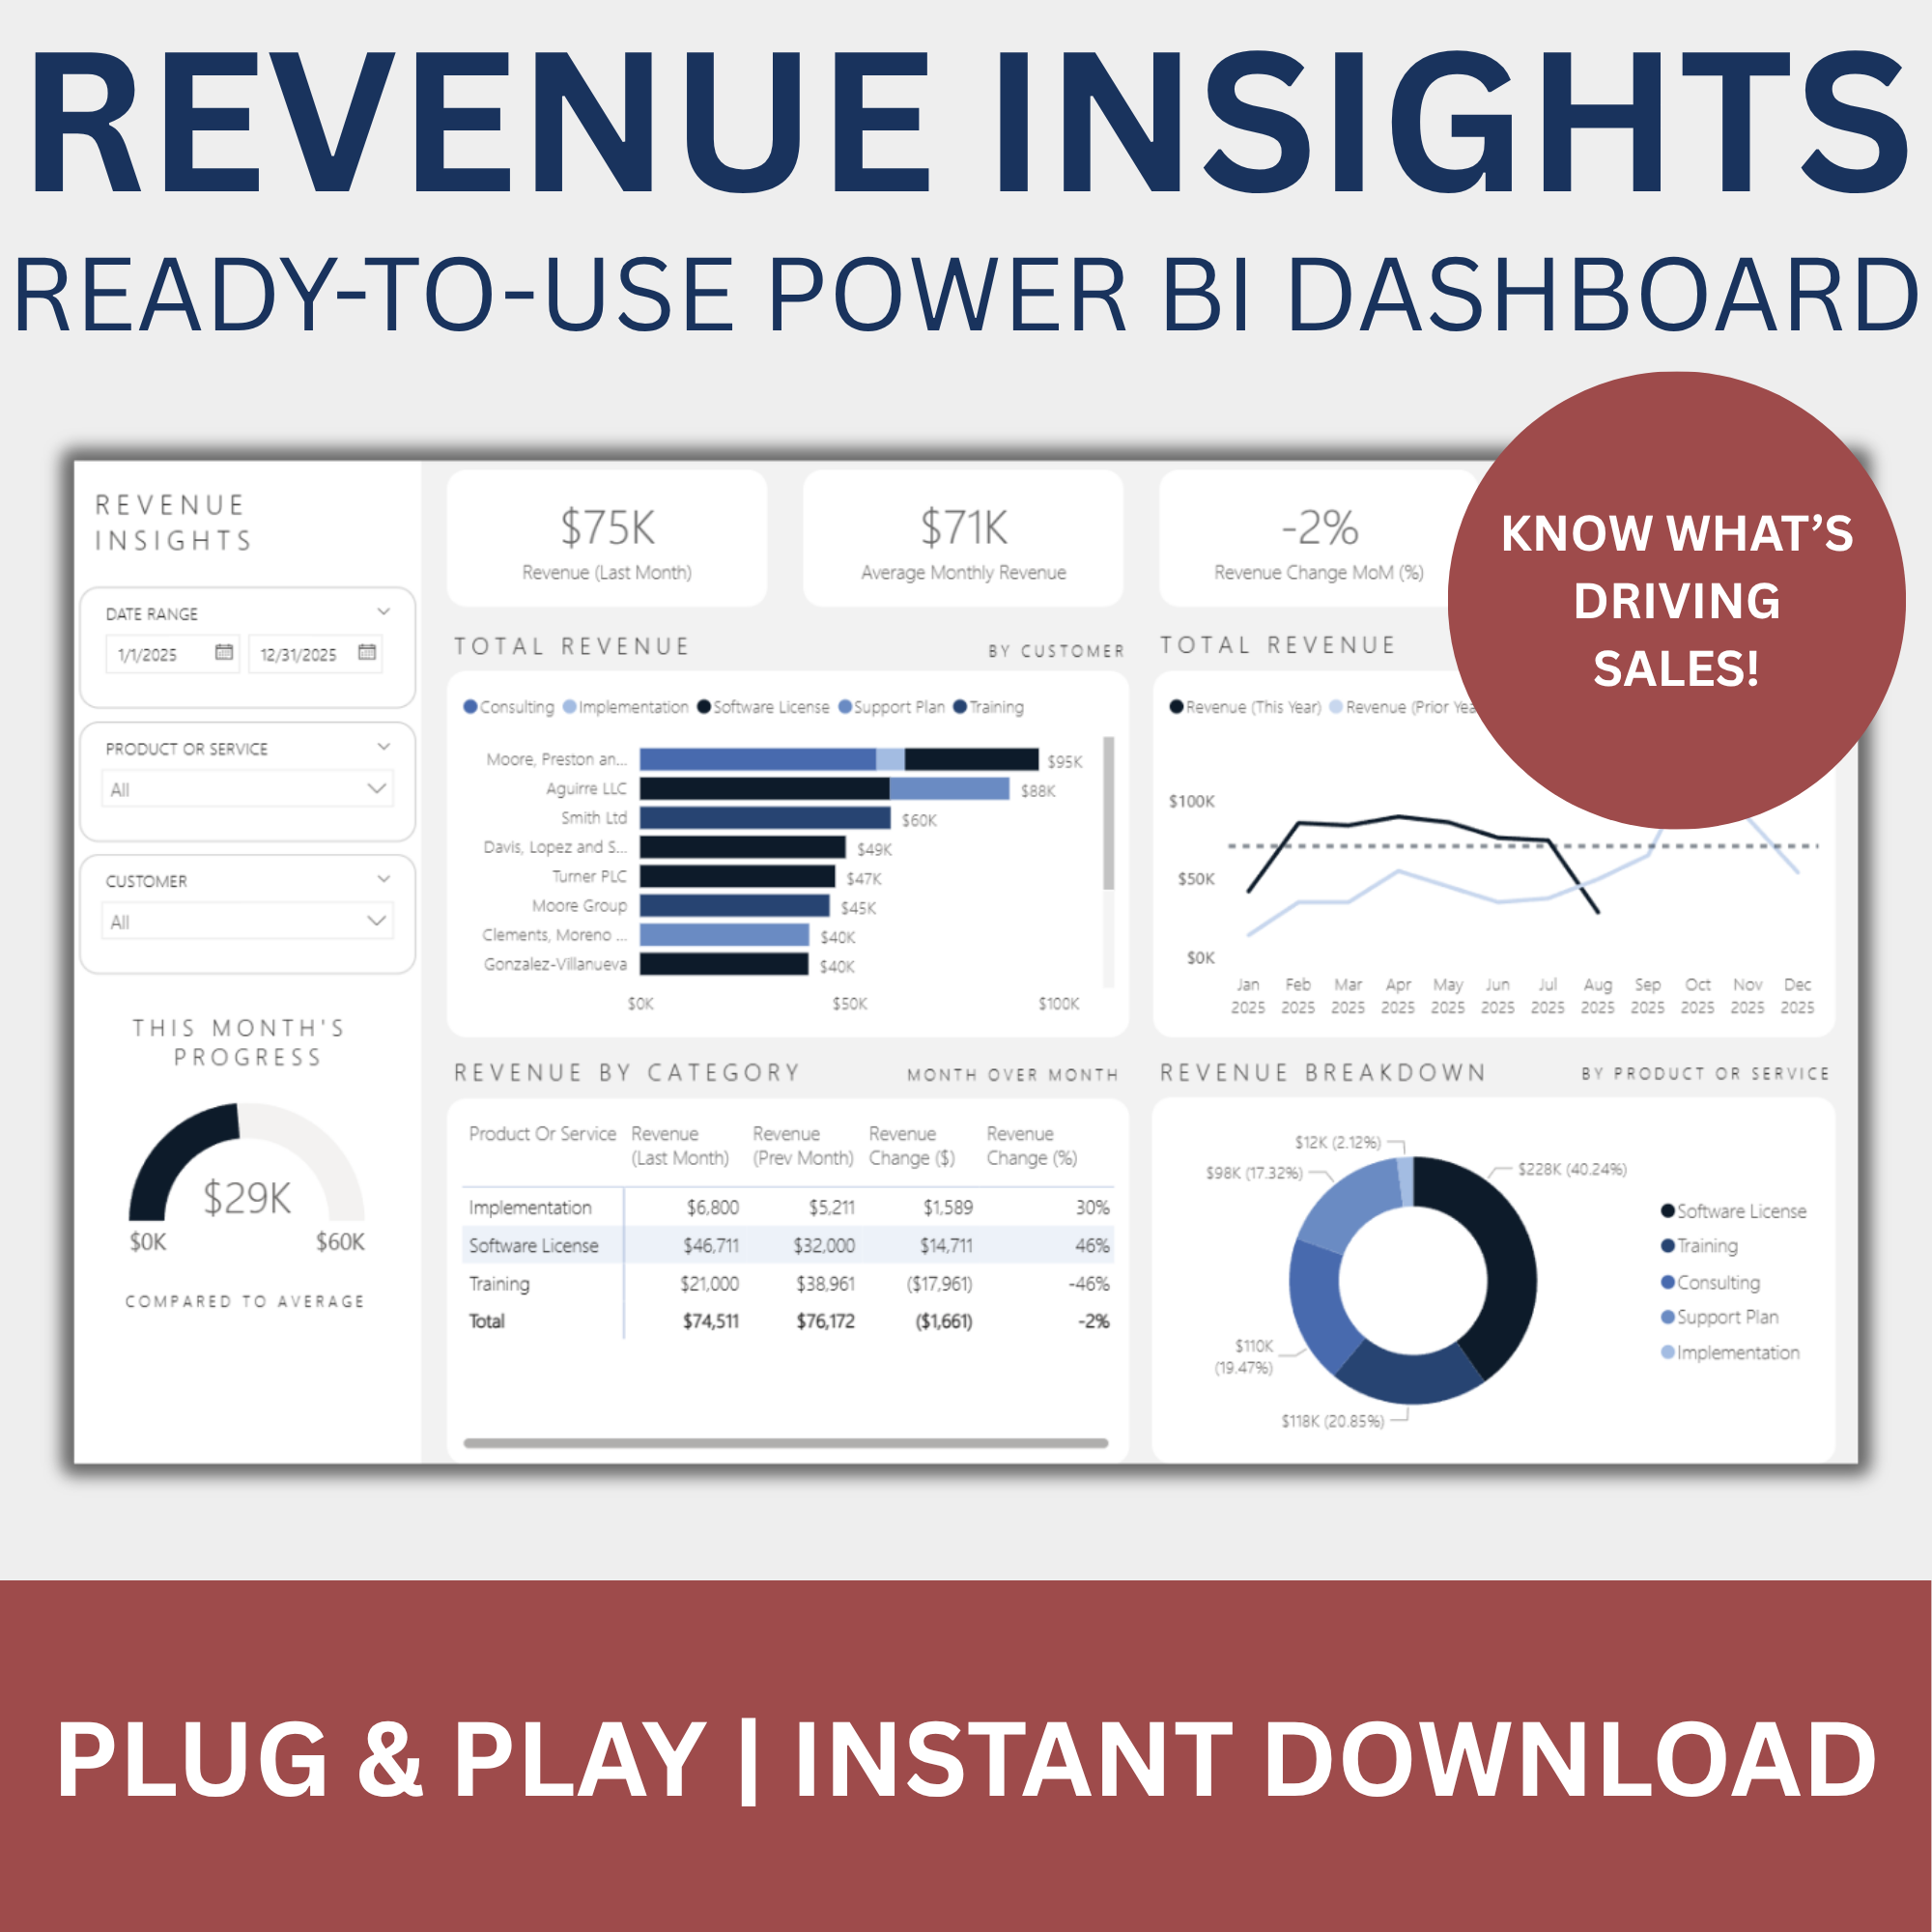 Image 2 of 2
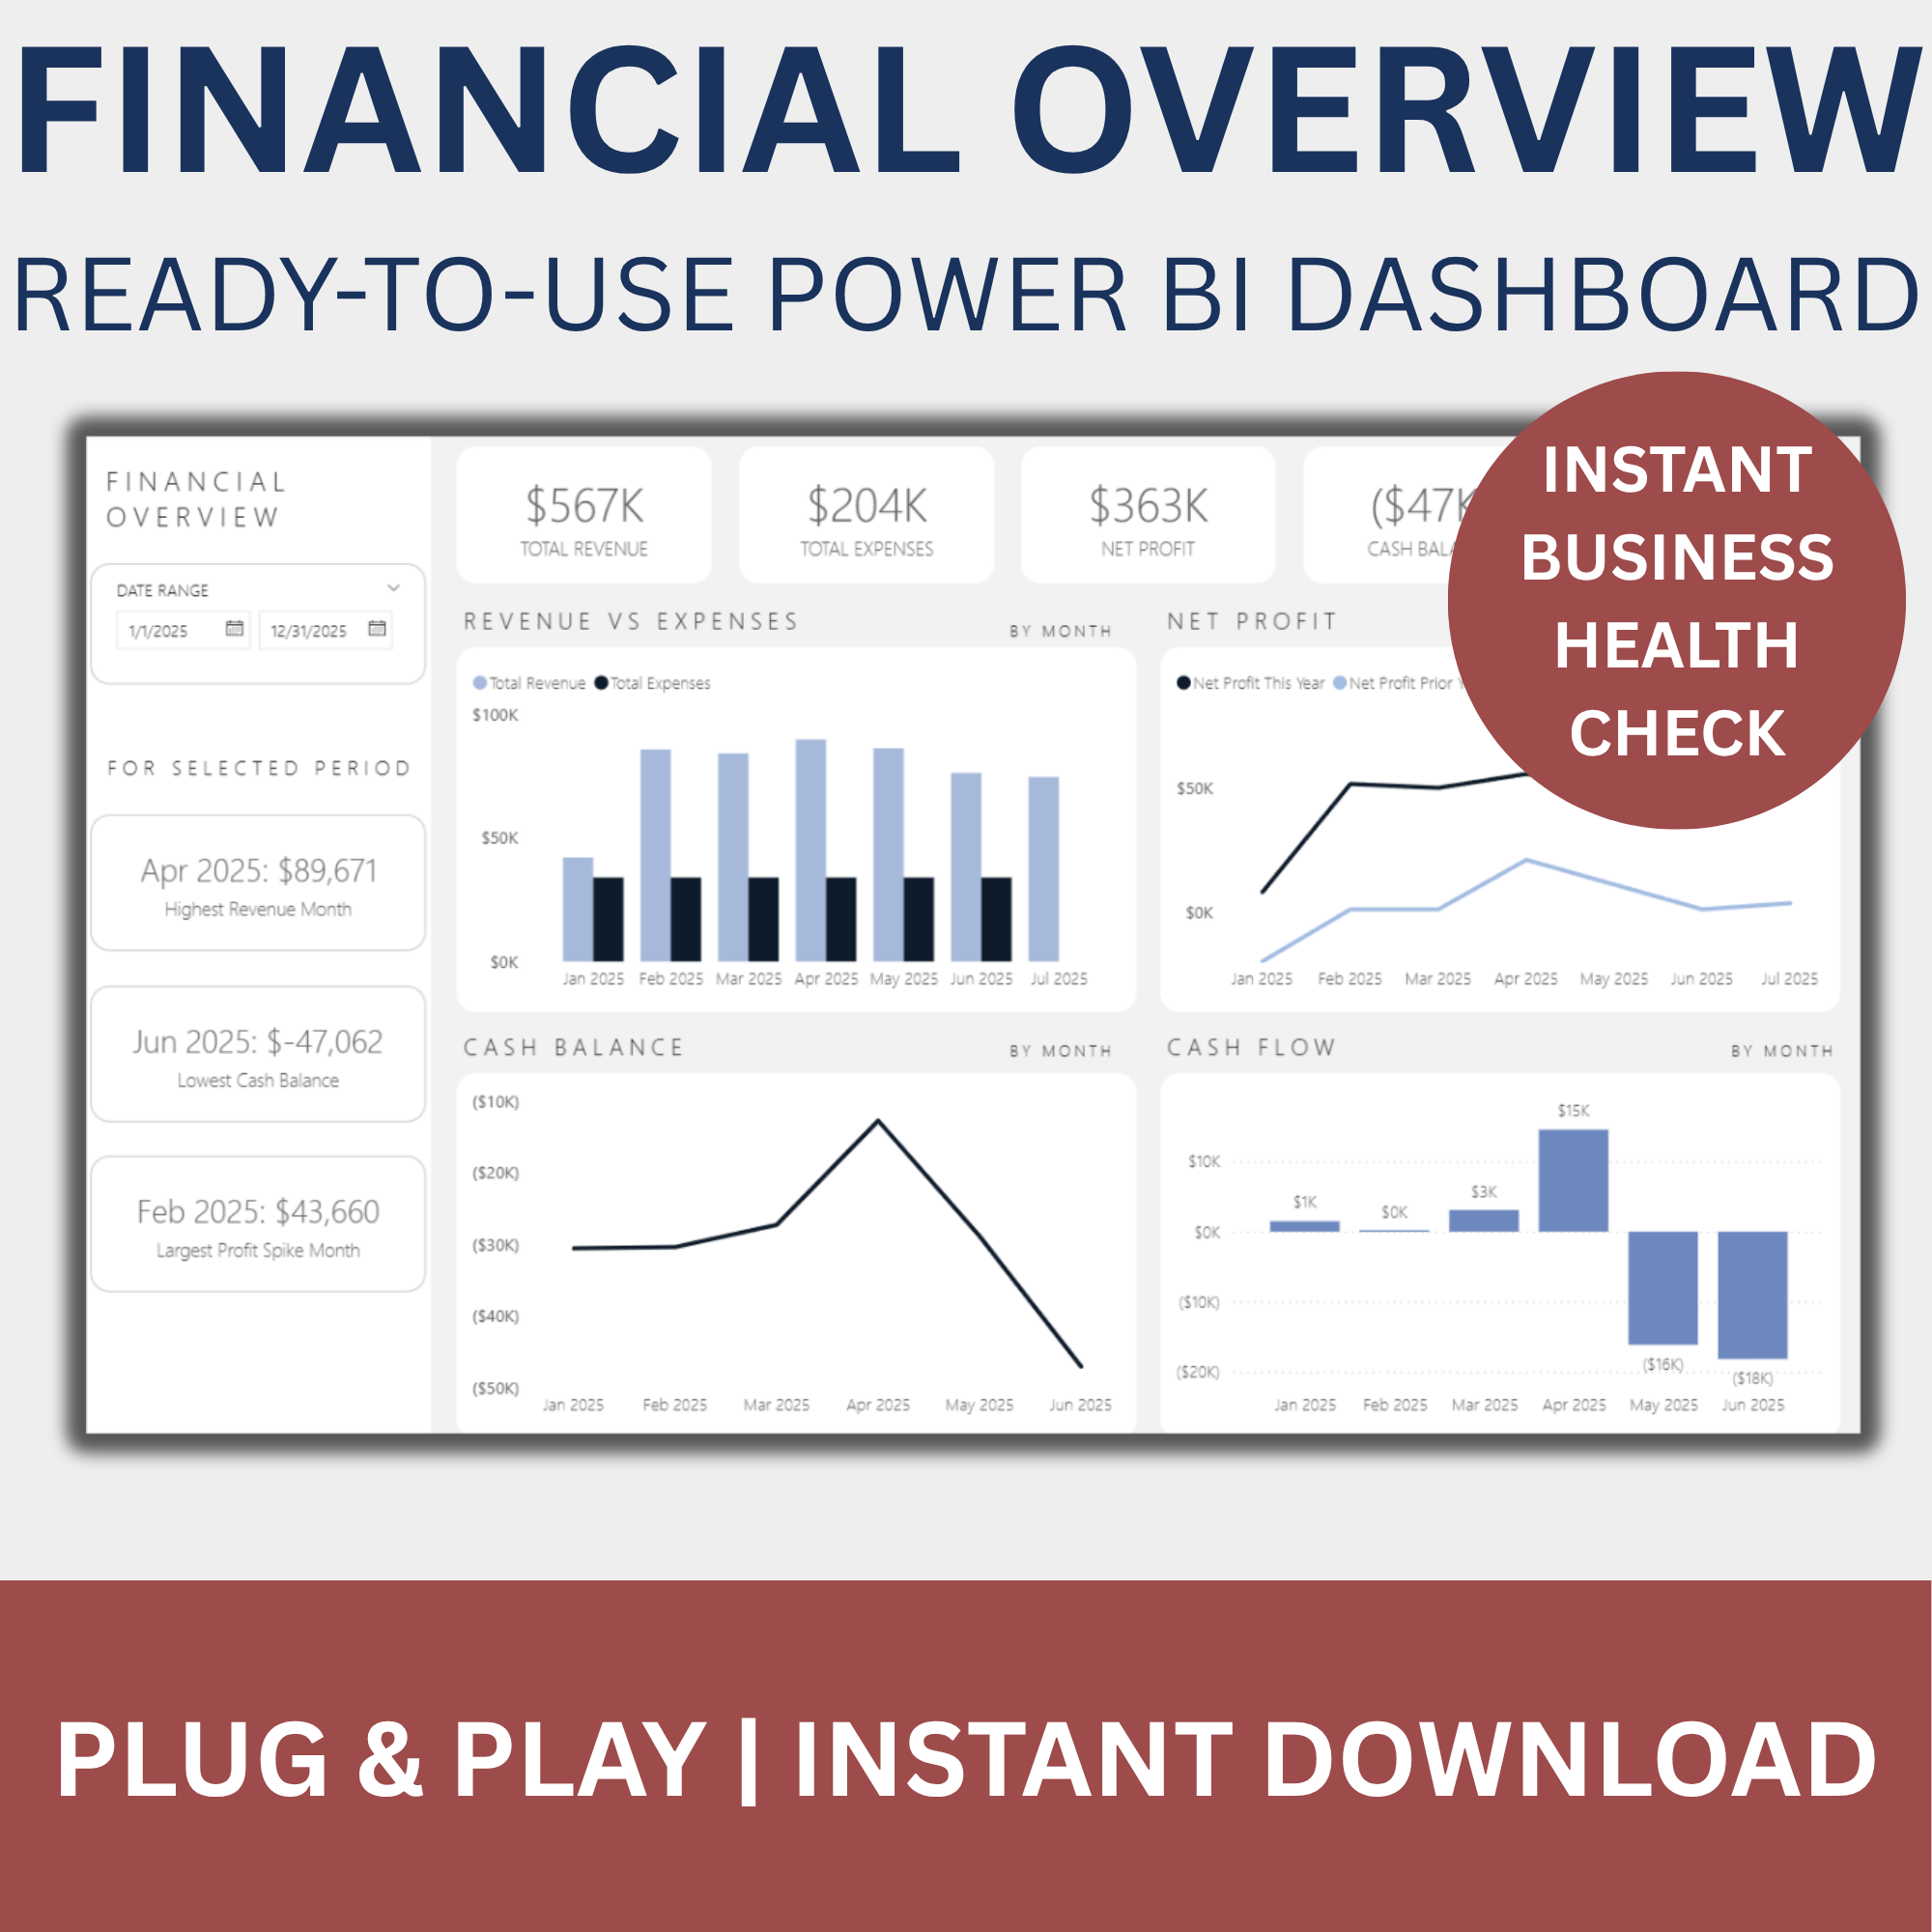
Revenue Insights Dashboard
$39.00
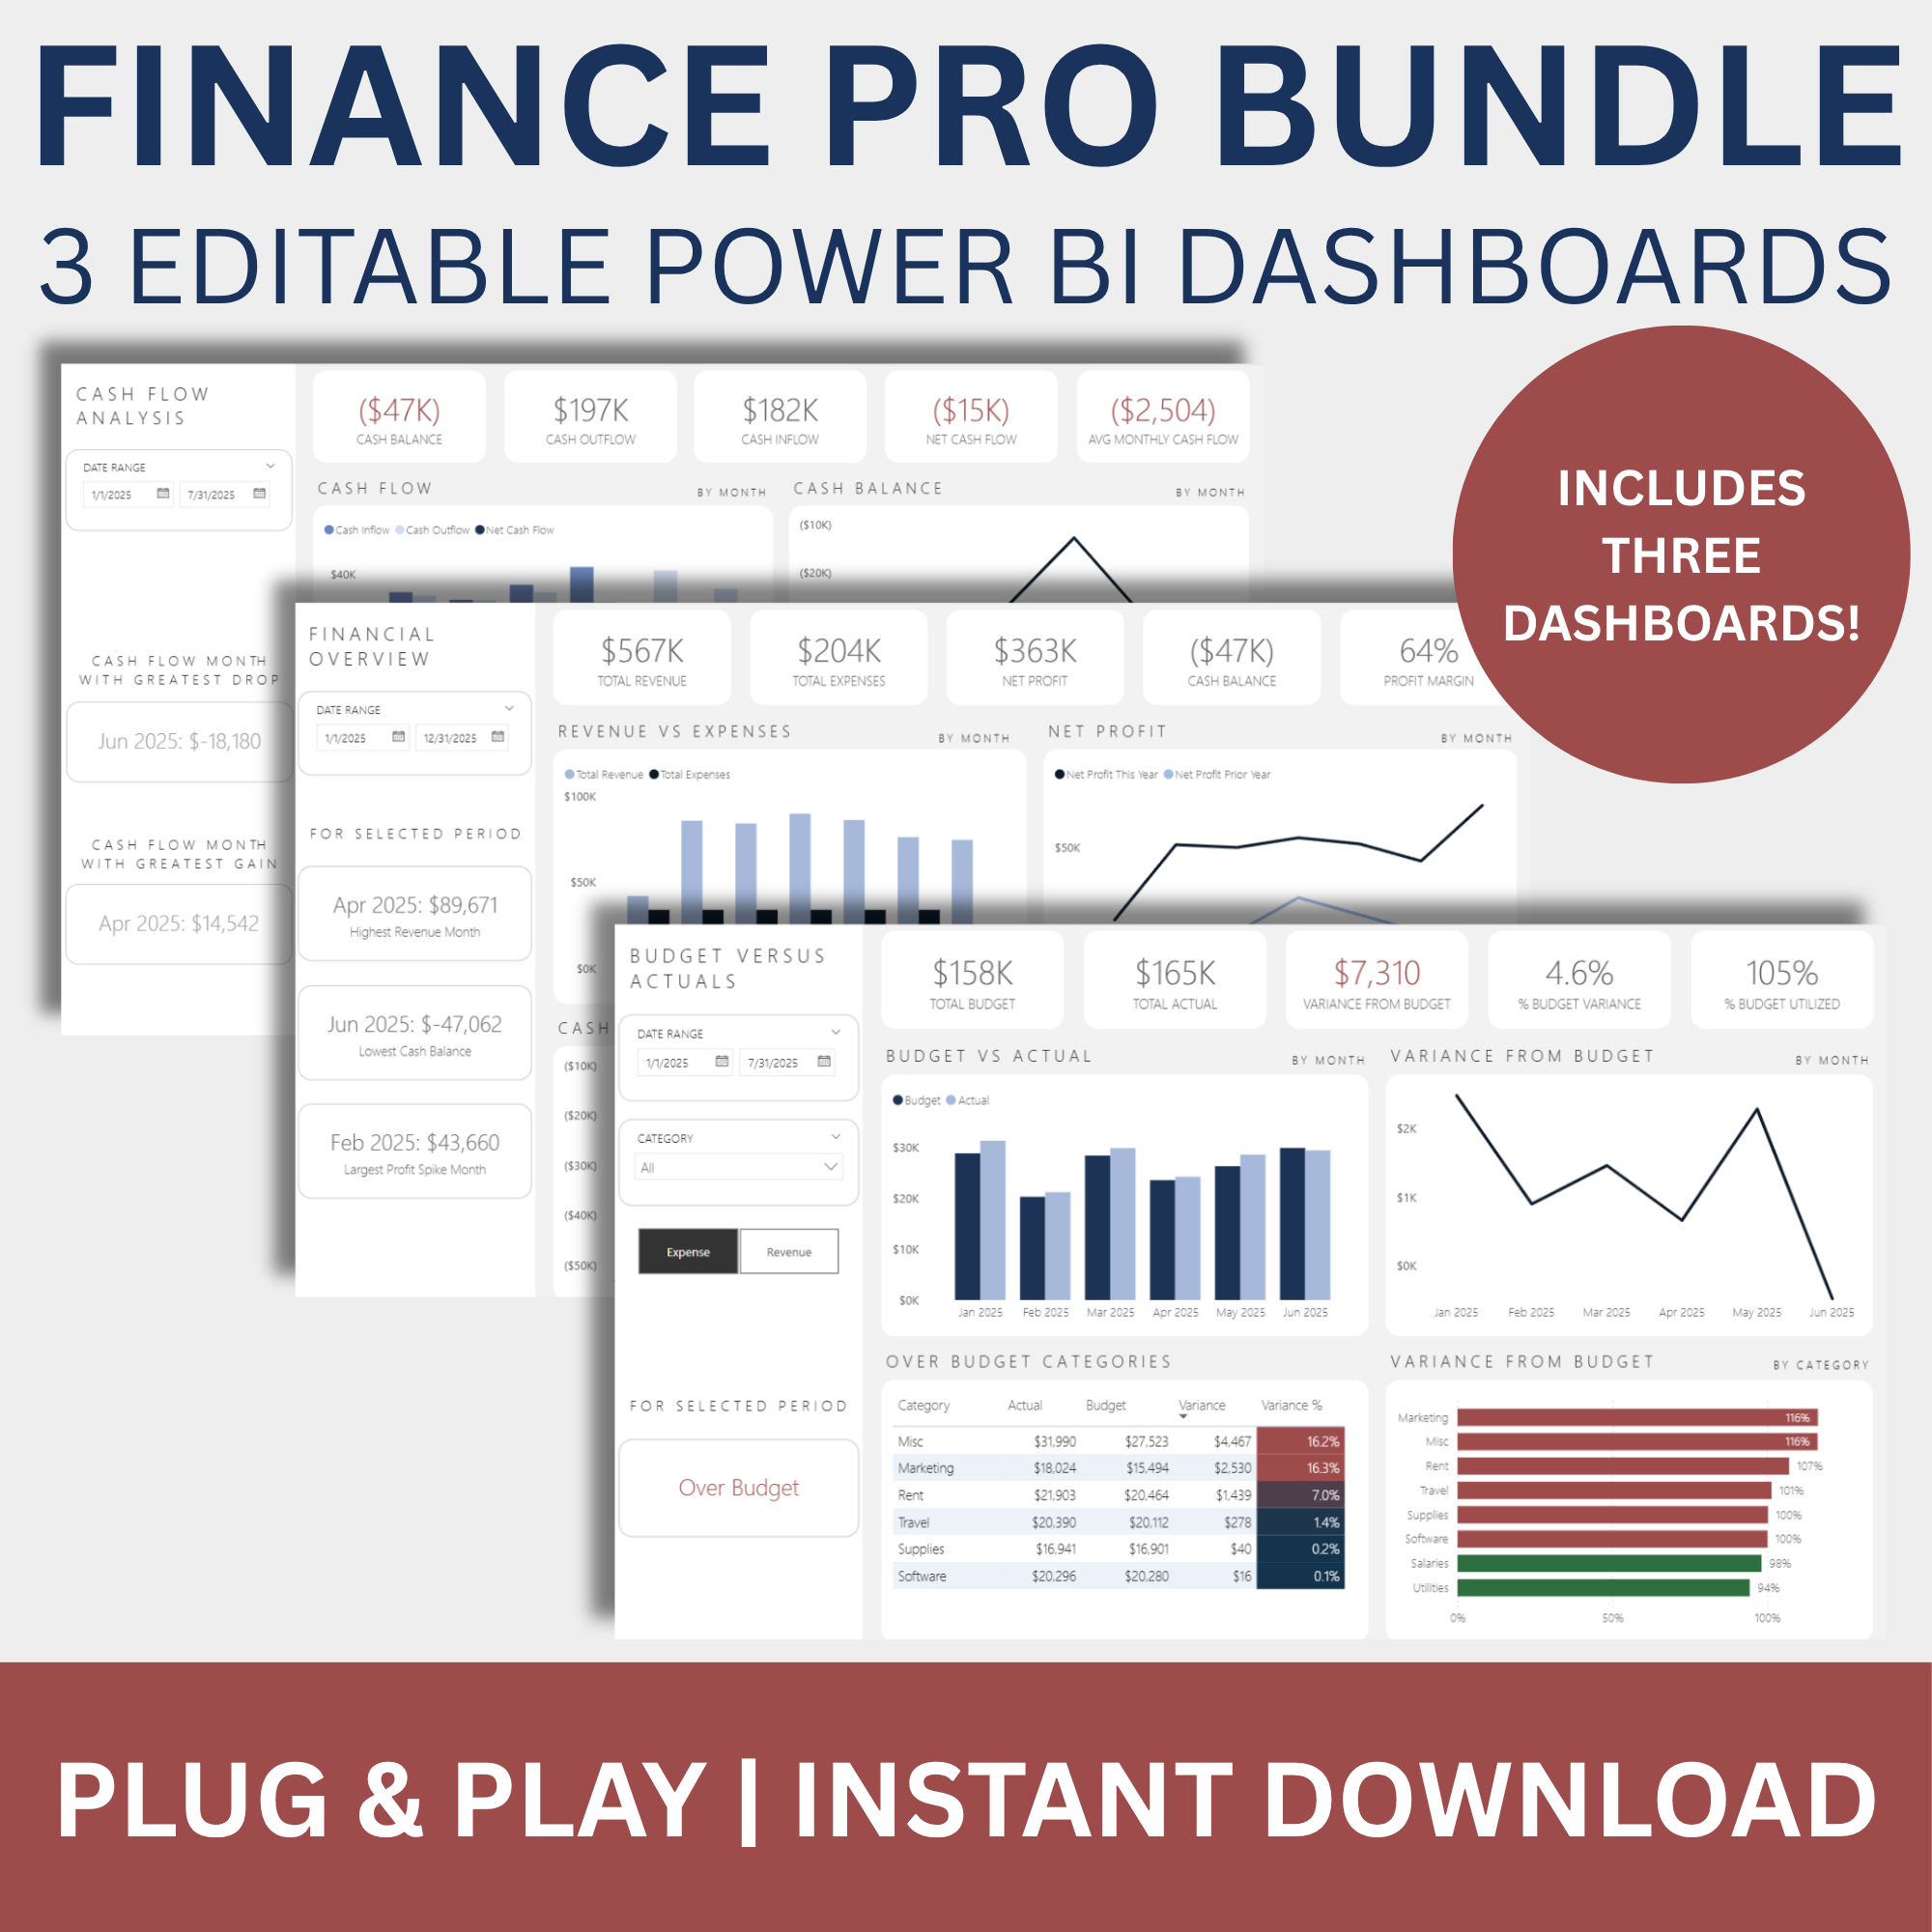
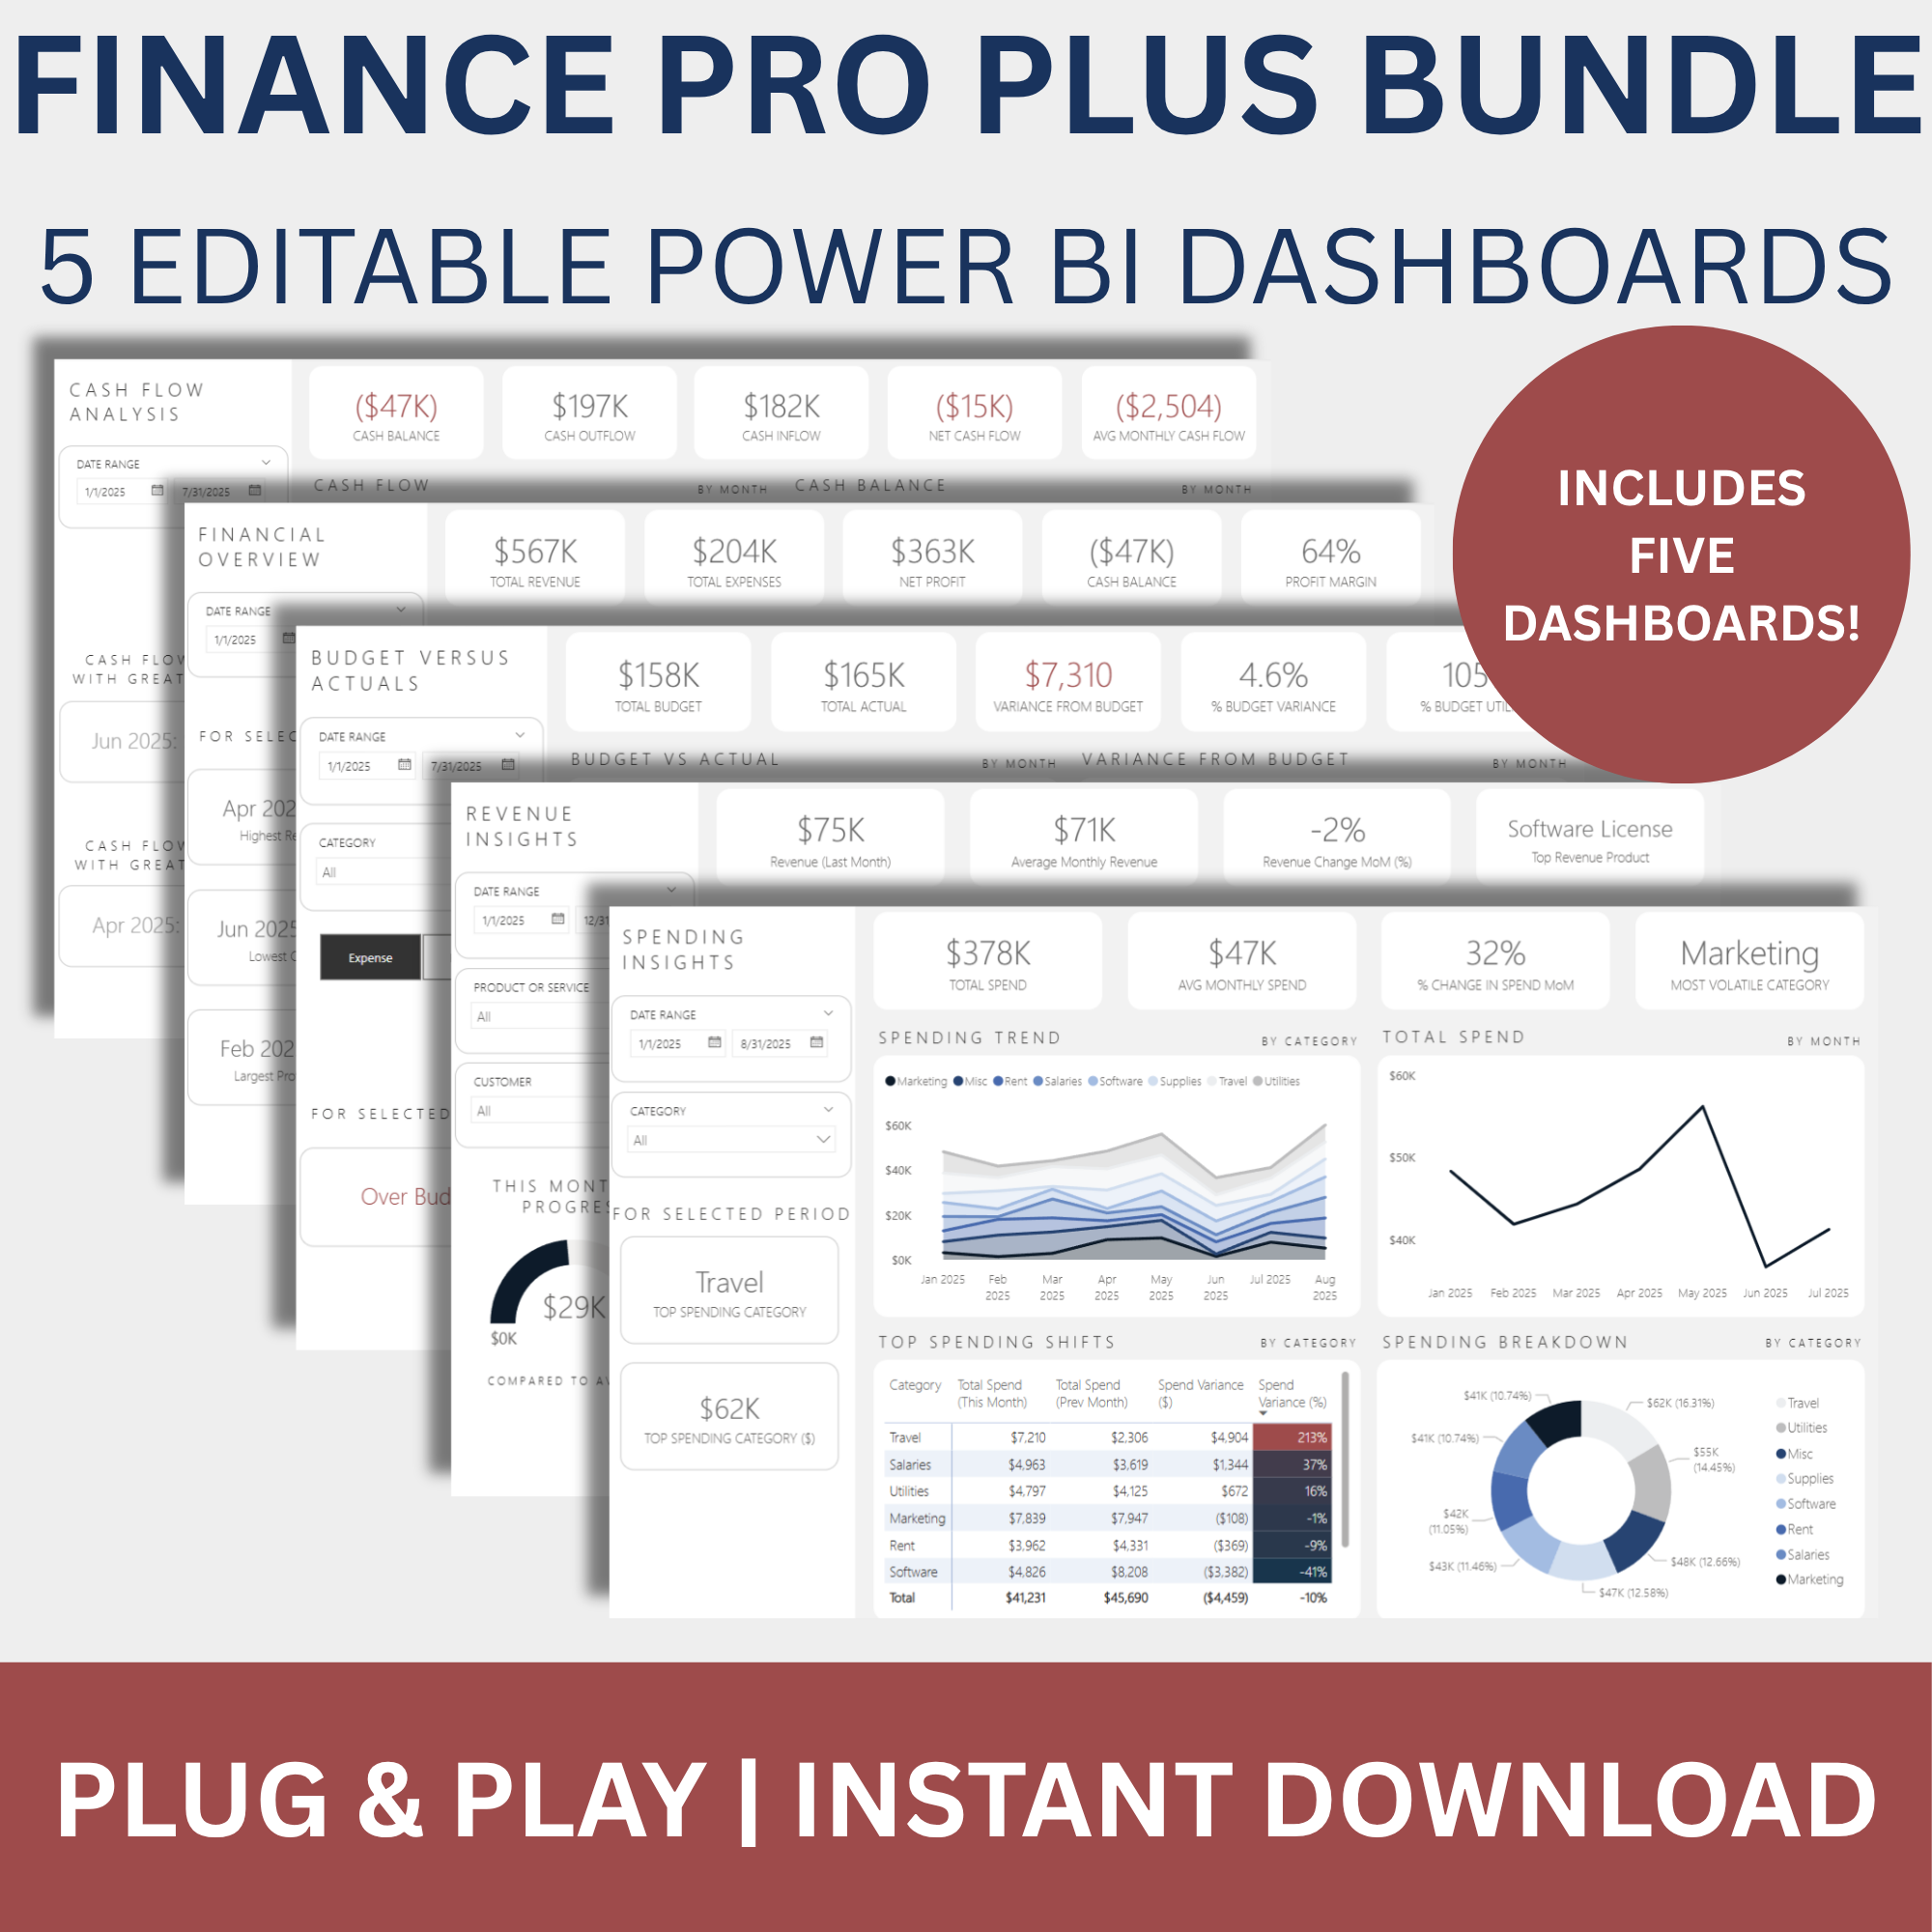
Understand exactly where your revenue is coming from and how it's trending with this powerful, ready-to-use Revenue Insights Dashboard. Designed for small to mid-sized businesses, this dashboard helps you break down income by product, customer, and time period—so you can identify top performers, uncover growth opportunities, and track progress toward monthly goals.
Instant Digital Download — Your dashboard will be delivered to your email immediately after checkout. No waiting, no shipping.
Key Features:
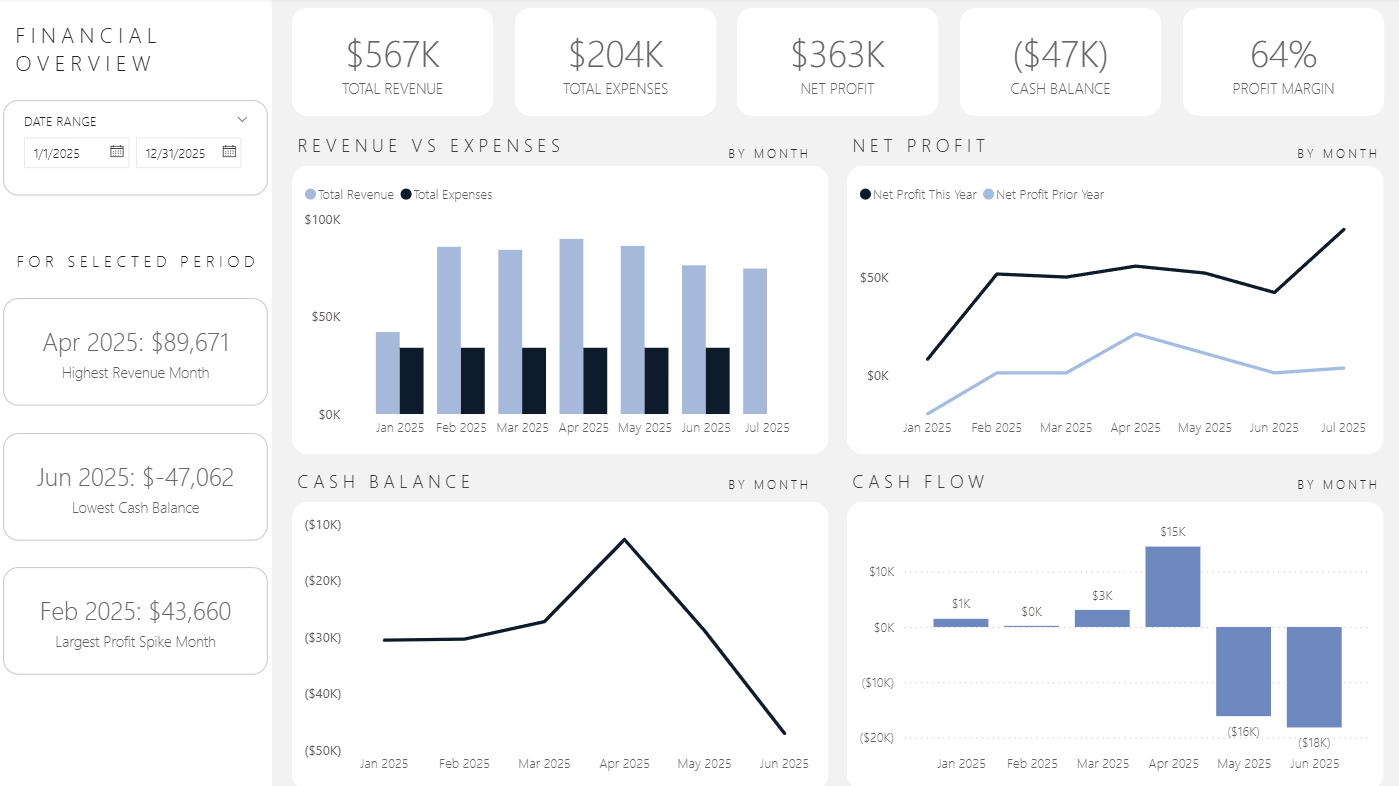
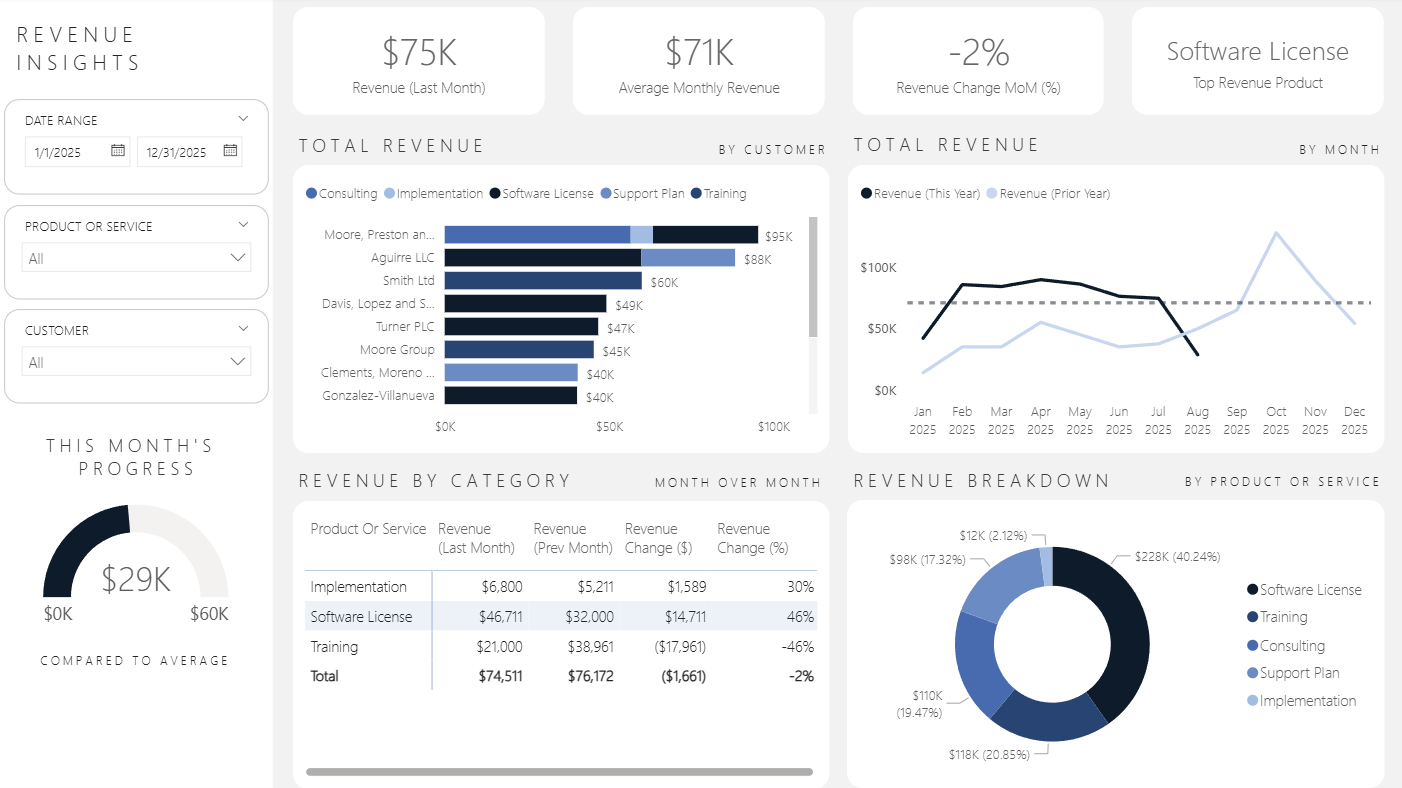
Revenue trends by month with optional prior year comparison
Breakdown by product/service and customer
Month-over-month growth analysis by category
KPI cards for total revenue, average monthly revenue, top products, and pacing
Progress gauge to track current month revenue vs historical average
Interactive slicers for date range, product, and customer
What You Get:
Power BI (.pbix) dashboard file
Sample Excel data file
Data dictionary with field definitions
Quick-start setup guide
Commercial use license
Whether you're a business owner, financial analyst, or consultant, this dashboard makes it easy to visualize and understand your revenue performance—without needing to build from scratch.
Understand exactly where your revenue is coming from and how it's trending with this powerful, ready-to-use Revenue Insights Dashboard. Designed for small to mid-sized businesses, this dashboard helps you break down income by product, customer, and time period—so you can identify top performers, uncover growth opportunities, and track progress toward monthly goals.
Instant Digital Download — Your dashboard will be delivered to your email immediately after checkout. No waiting, no shipping.
Key Features:
Revenue trends by month with optional prior year comparison
Breakdown by product/service and customer
Month-over-month growth analysis by category
KPI cards for total revenue, average monthly revenue, top products, and pacing
Progress gauge to track current month revenue vs historical average
Interactive slicers for date range, product, and customer
What You Get:
Power BI (.pbix) dashboard file
Sample Excel data file
Data dictionary with field definitions
Quick-start setup guide
Commercial use license
Whether you're a business owner, financial analyst, or consultant, this dashboard makes it easy to visualize and understand your revenue performance—without needing to build from scratch.