 Image 1 of 2
 Image 2 of 2
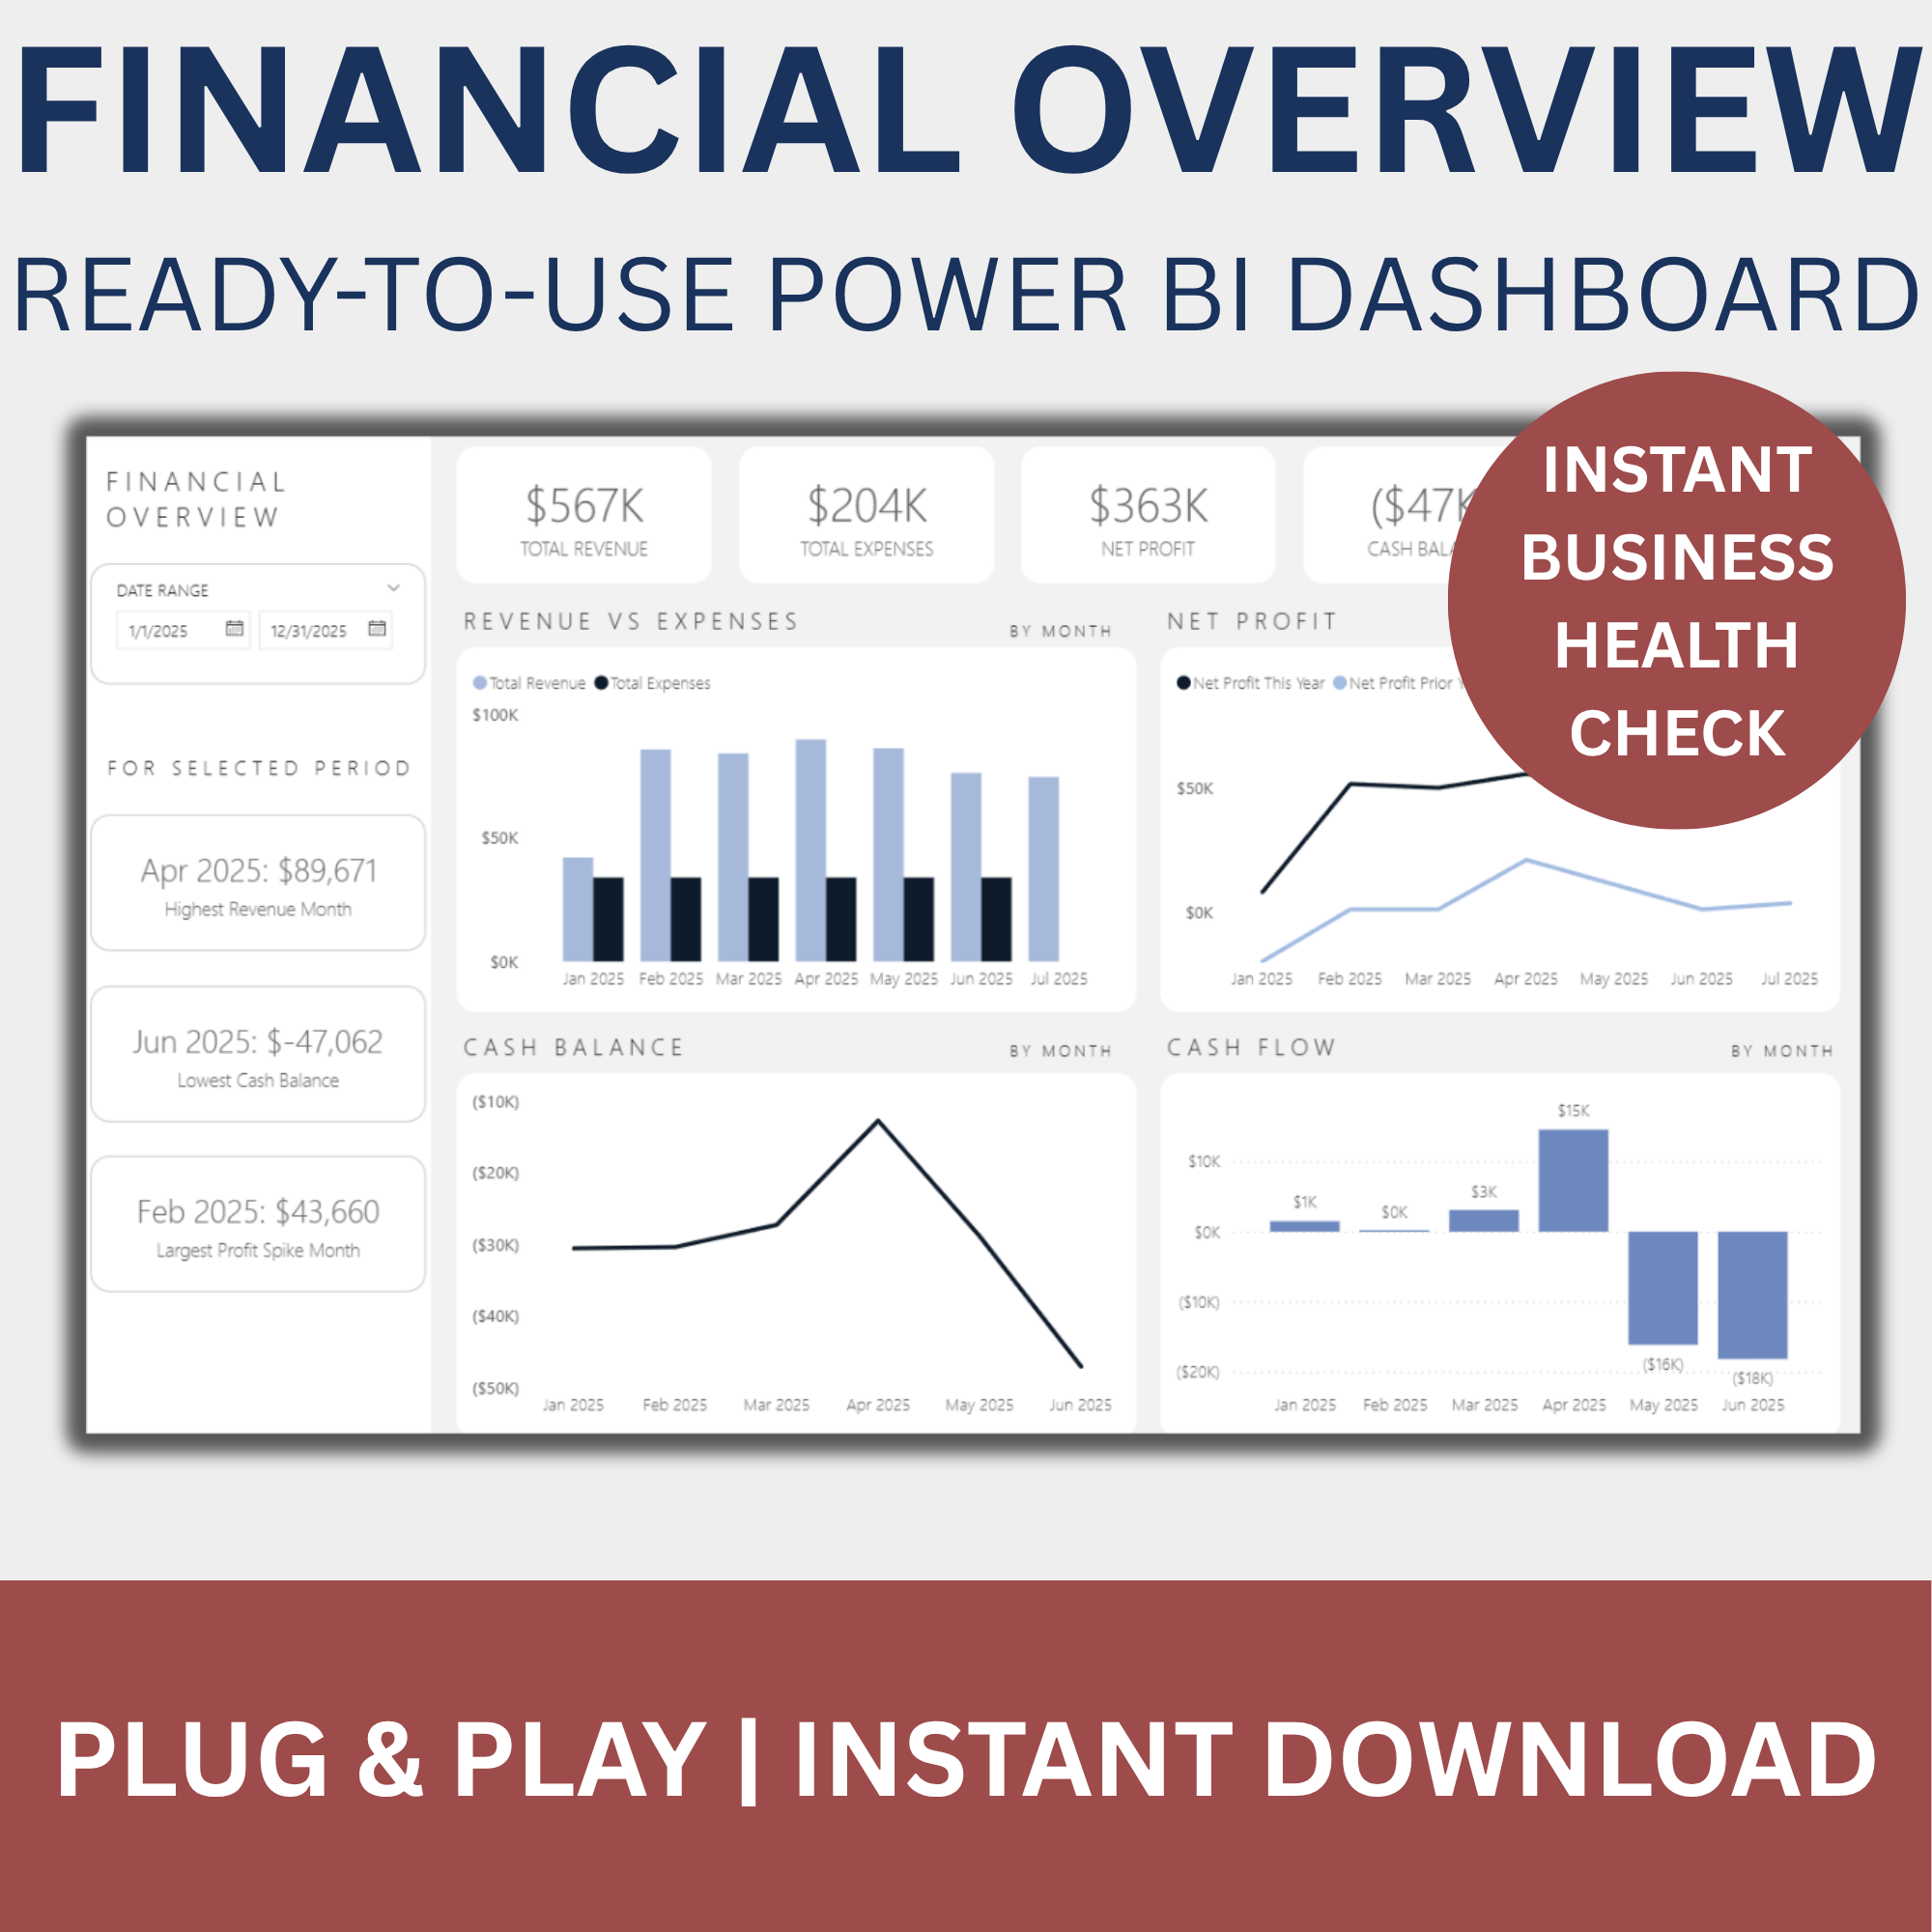
Spending Insights Dashboard
$39.00
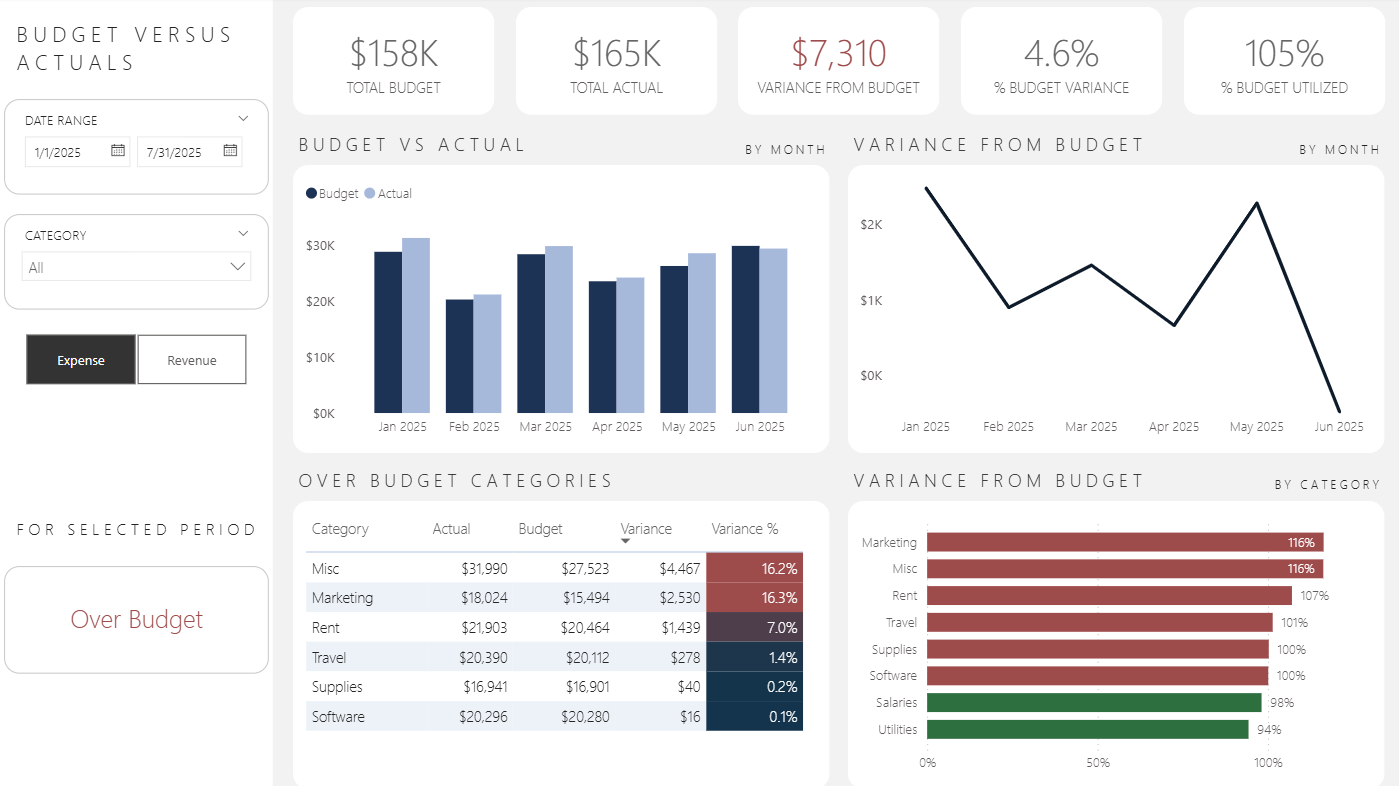
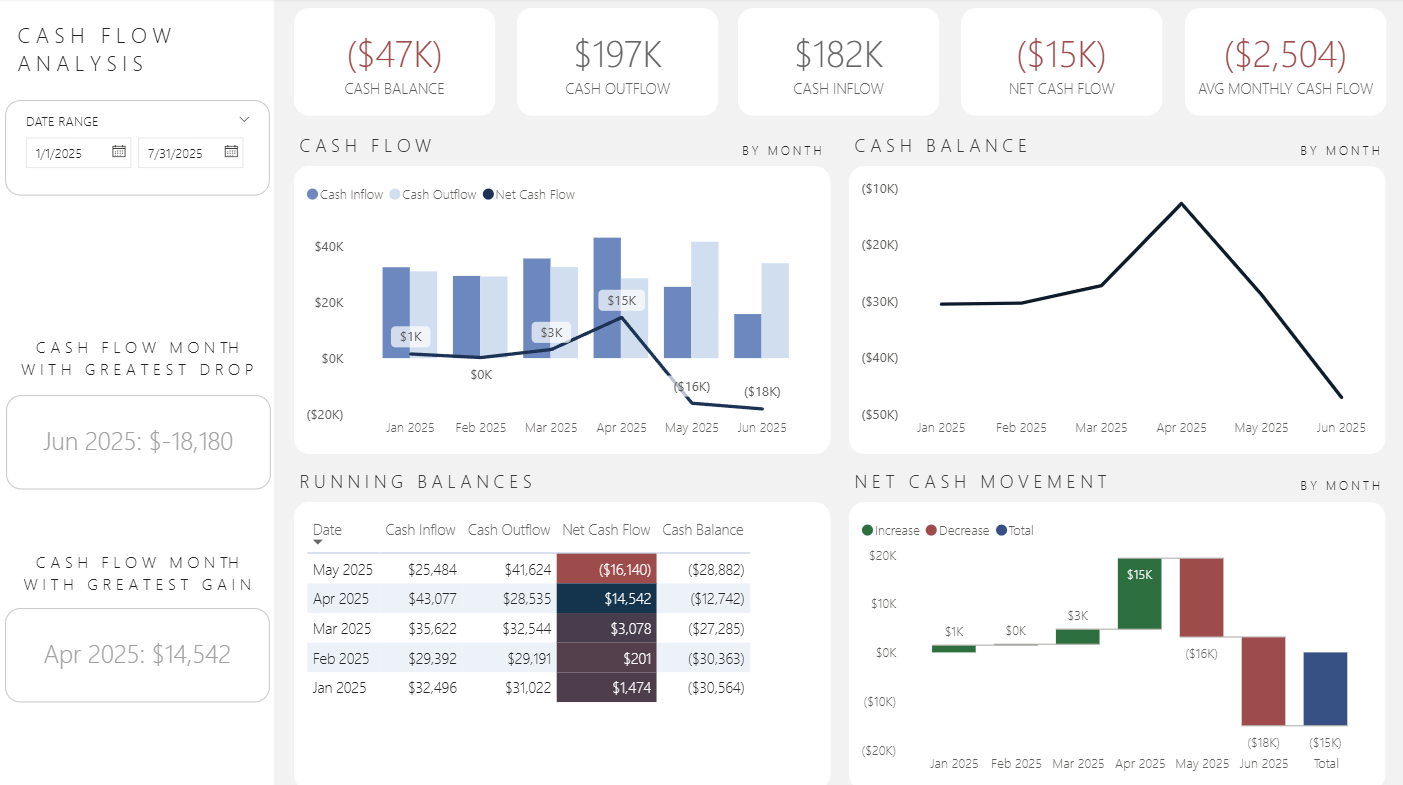
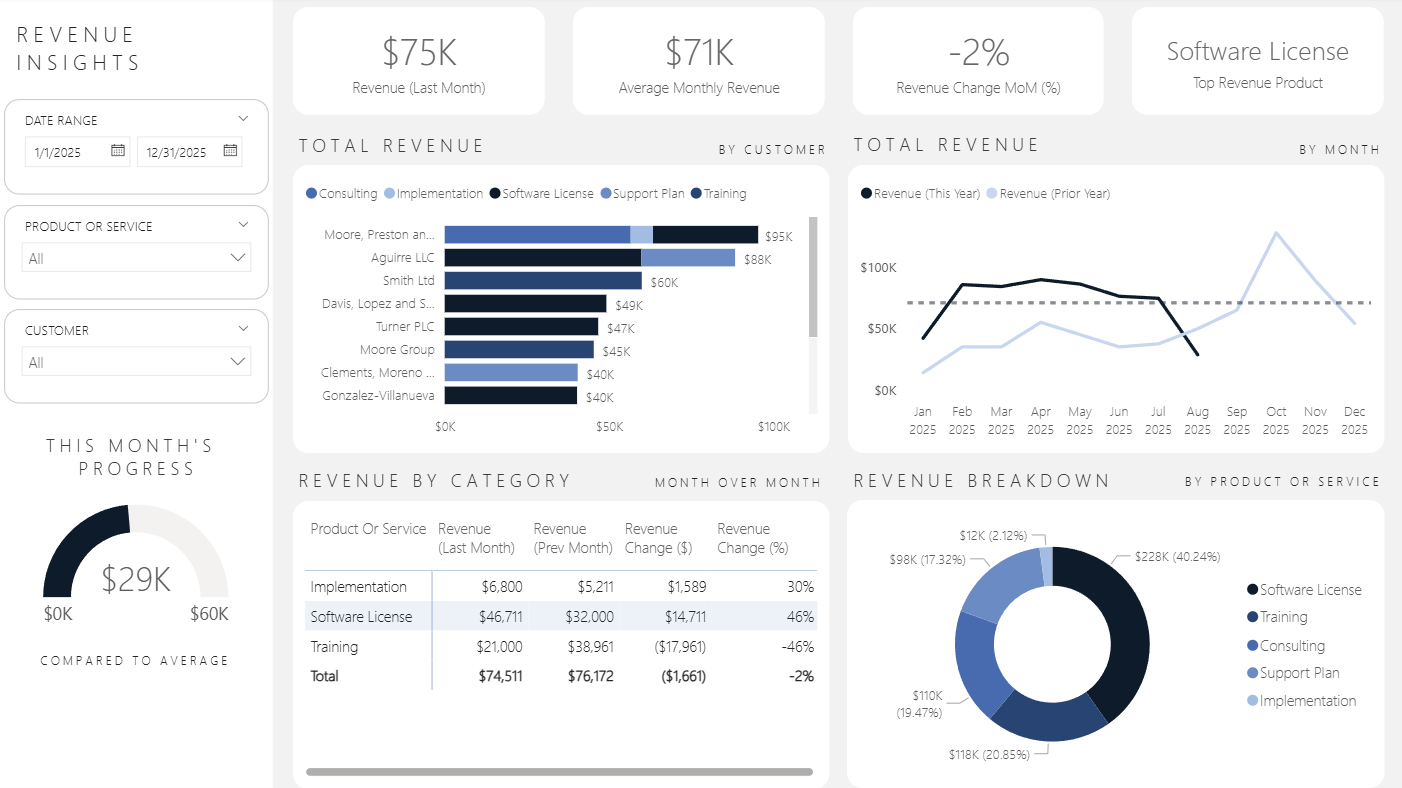
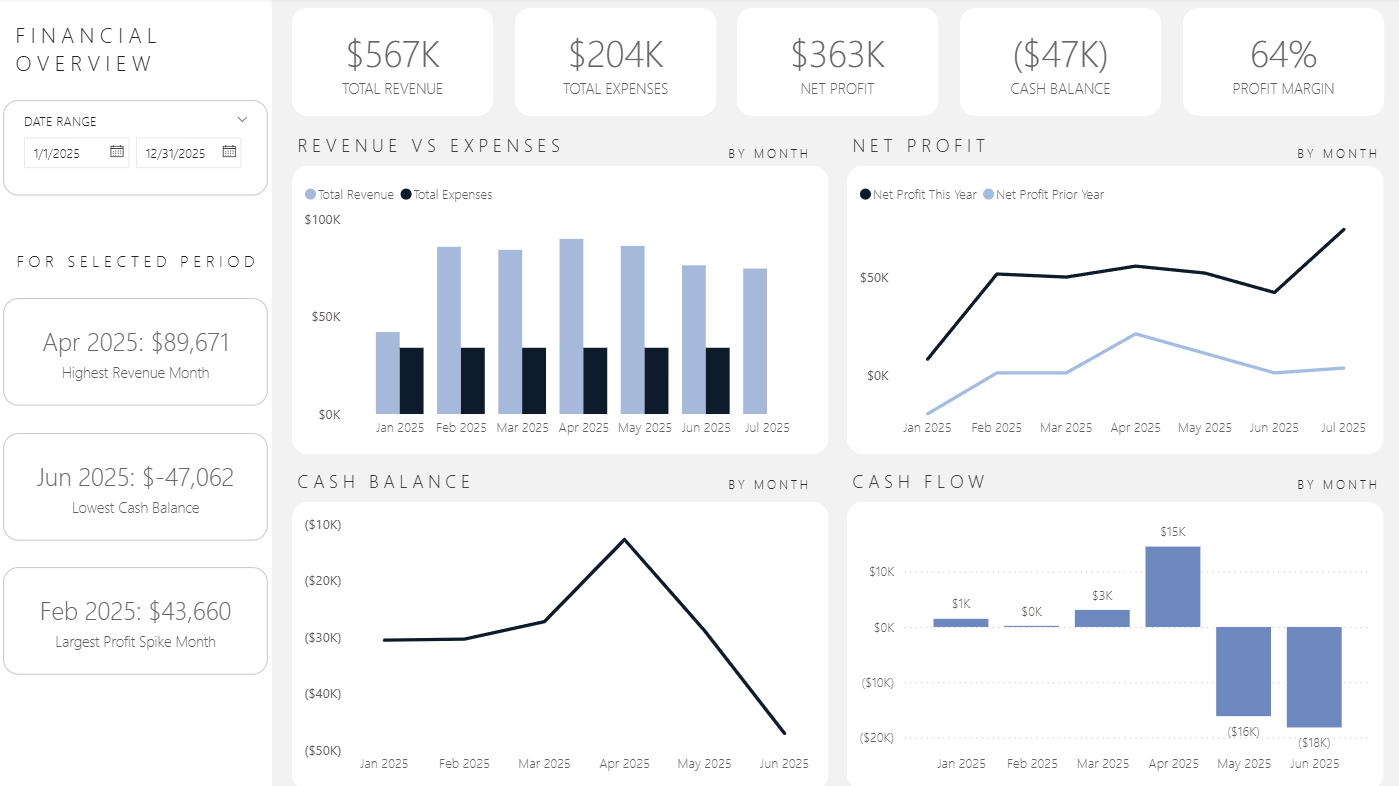
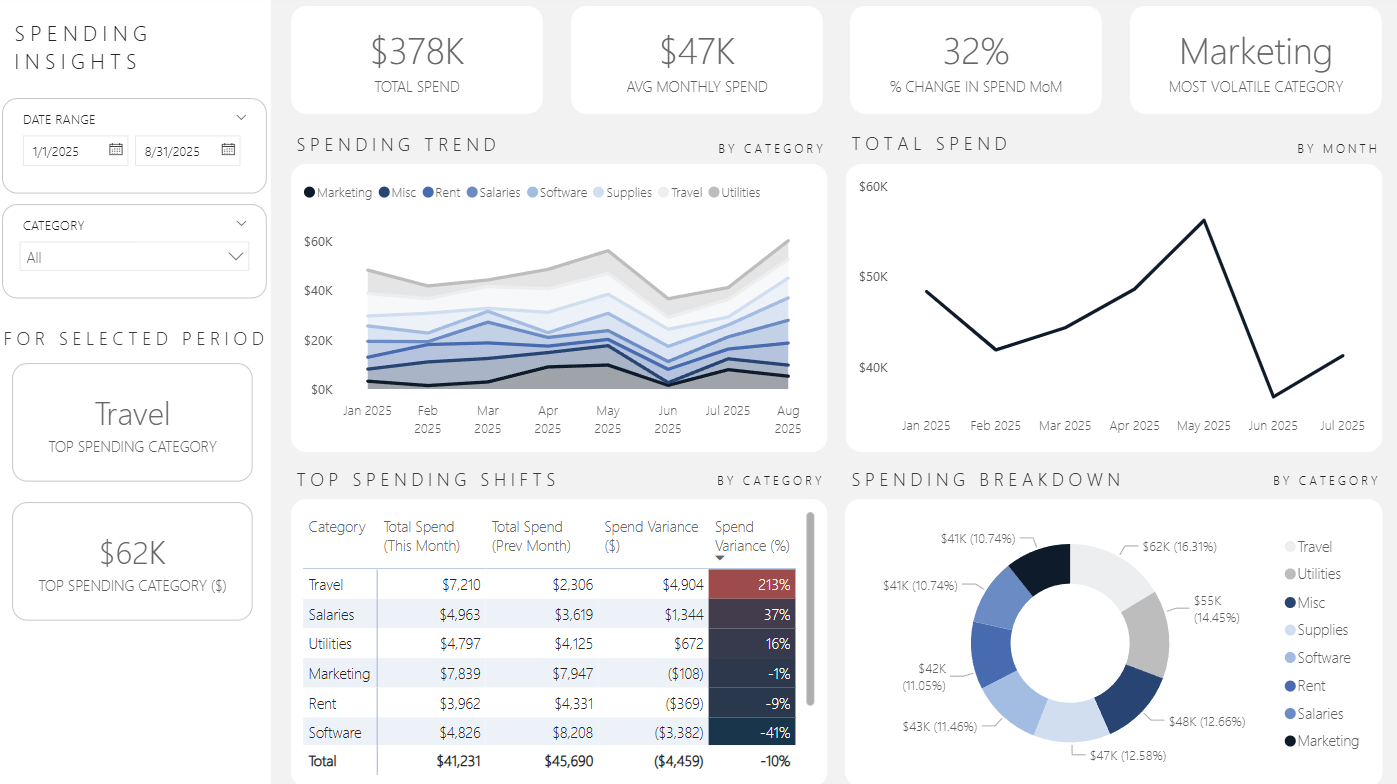
Take control of your business expenses with the Spending Insights Dashboard — a clean, intuitive Power BI report that helps you monitor where your money is going, how spending trends over time, and which categories are driving the most cost.
Instant Digital Download — Your dashboard will be delivered to your email immediately after checkout. No waiting, no shipping.
Key Features:
Total spend over time with trend line
Donut chart showing expense breakdown by category
Month-over-month variance matrix to highlight spending shifts
KPI cards for total spend, average monthly expenses, top expense category, and high-variance areas
Interactive slicers for date range and category filtering
What You Get:
Power BI (.pbix) dashboard file
Sample Excel data source
Data dictionary
Setup guide
Commercial license for business use
Perfect for business owners, finance teams, and consultants who want to visualize expenses and quickly spot changes—without needing to build from scratch.